Summary
Success in trading requires strategic positioning on the favourable side of the market while minimizing subjectivity. Achieving these dual objectives involves the utilization of automatic trading algorithms that generate clear signals based on comprehensive data analysis.
In the context of this study, the primary objective is to formulate a reliable model capable of anticipating the future direction of the stock market, aiming to outperform the S&P 500. To realize this goal, we investigate the information about potential market directions provided by the New York Stock Exchange (NYSE) New 52-Week Highs and New 52-Week Lows (NH, NL).
The underlying hypothesis of this research asserts that NYSE NH and NL offer dependable information for predicting stock market direction. Considering the close to 3000 issues traded on the NYSE, the number of stocks reaching new highs or lows could potentially unveil the market's movement direction. A substantial number of stocks hitting new highs suggests broad market strength, while a surge in new lows signals broader market weakness. This comprehensive approach seeks to enhance our understanding of market dynamics and improve the accuracy of predictive models.
Introduction
To assess the reliability of New Highs and New Lows in predicting market direction, this study employs two distinct and independent approaches:
Model based on the Analysis of NH and NL Counts and Their Relationship
Characteristics:
- Timeframe: daily,
- Trading frequency: daily
- Signals: Long and Short based on the relationship between New High New lows
Execution:
Calculate the signal at the End of the day, Entry next day at Open if signal Close the following day allowing entry the same day if there is signal.Model Based on the Values of a New High New Lows Oscillator
Characteristics:
- Timeframe daily
- Trading frequency based on the values provided by the Oscillator.
- Signals: Long signals based on Oversold and overbought levels of the Oscillator.
Execution:
When the oscillator cross certain levels open or close position.
Dataset
To implement the models, we utilized the daily count of stocks in the NYSE making new 52-week Highs (NH) and the daily count of stocks making new 52-week Lows (NL) from 2005 until November 2013
The data has been divided into 3 datasets:
- In-sample data: 2008 – 2020 (13 years)
- out-sample: 2005-2007 (3 years)
- Post out-sample:2021 - 2023 (3 years)
Study 1
Model based on the Analysis of NH and NL Counts and Their Relationship
This model uses the daily value of New Highs and New Lows, as well as their ratio to timing the market.
This model is based on the daily values of New Highs and New Lows, and their ratio for precise market timing. By analysing shifts in market sentiment through these metrics, the model aims to provide traders with valuable insights into potential trend. This approach capitalizes on the belief that extremes in market breadth can precede significant price movements
Generic Rules:
Note: The specific rules are intentionally omitted in this publication as it is not the primary focus. The objective of this study is to highlight the valuable insights gained from observing New Highs (NH) and New Lows (NL) when making investment decisions.
Long Side (based on 3 simple rules)
Open Position: (If the following rules are meted, open position next day at Open)
- Number of NH is greater than certain value
- NL and NL lower than certain value
- The ration NH/NL exceed certain value
Close Position:
- Next day at open market
Long Side (based on 3 simple rules)
Open Position: (If the following rules are meted, open position next day at Open)
- Number of NL is smaller than certain value
- NL and NL than certain value
- The ration NH/NL exceed certain value
Close Position:
- Next day at open market
Execution:
- Open position (short or long) the next day at Market Open.
- Close position the following day at Market Open.
Results:
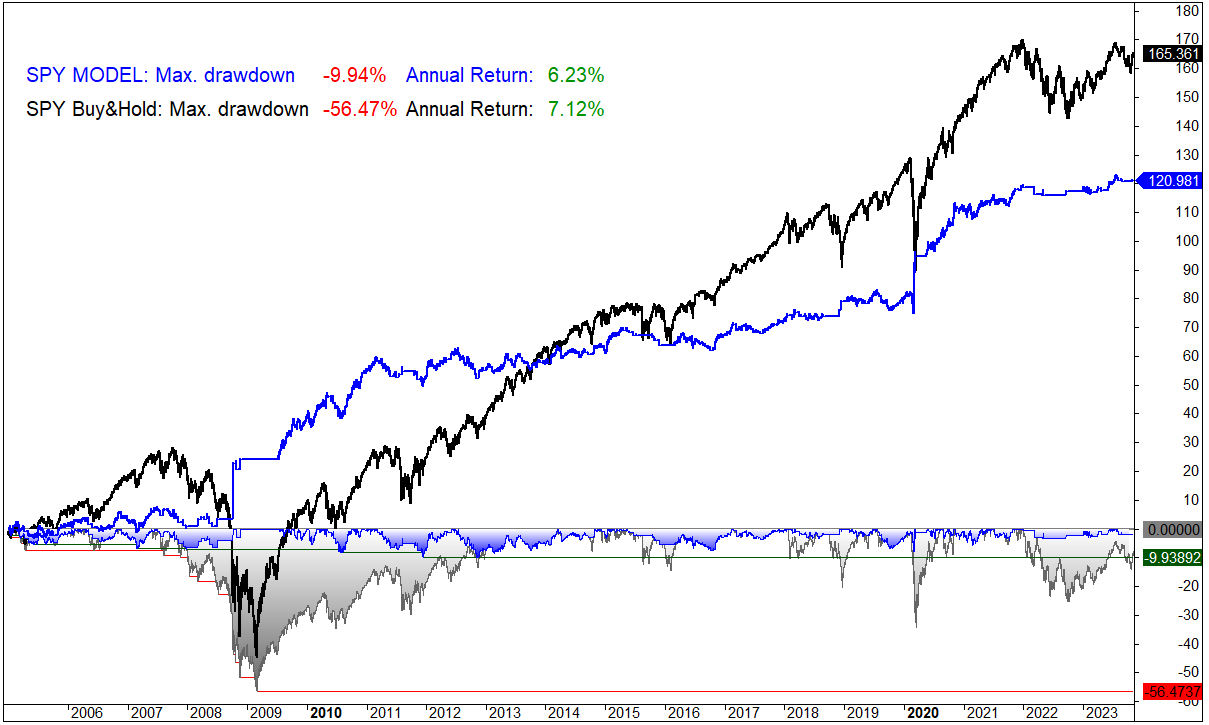
The model is applied to SPY and compared against the SPY Buy & Hold strategy.
Fig. 1 SPY yearly returns Model vs Buy & Hold:
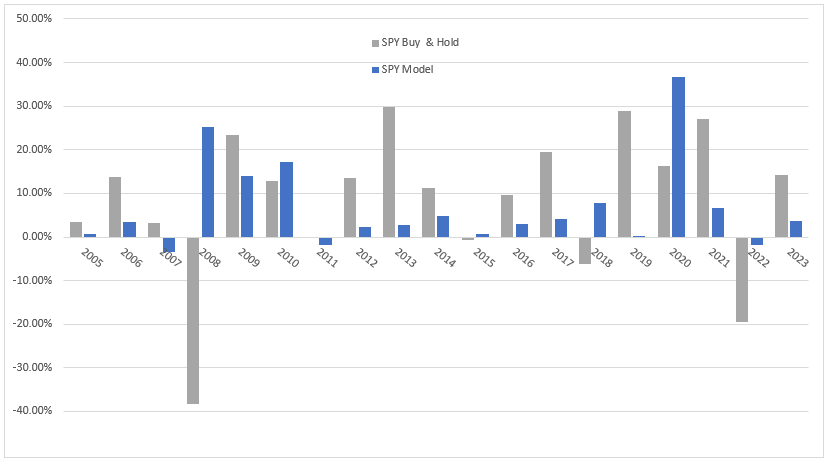
Fig.2 SPY Profit and Draw Down graph Model vs Buy & Hold:
Study 2
Model based on a New High New Lows Oscillator
This model used an Oscillator based on the NH NL values that potentially could timing the market for long positions.
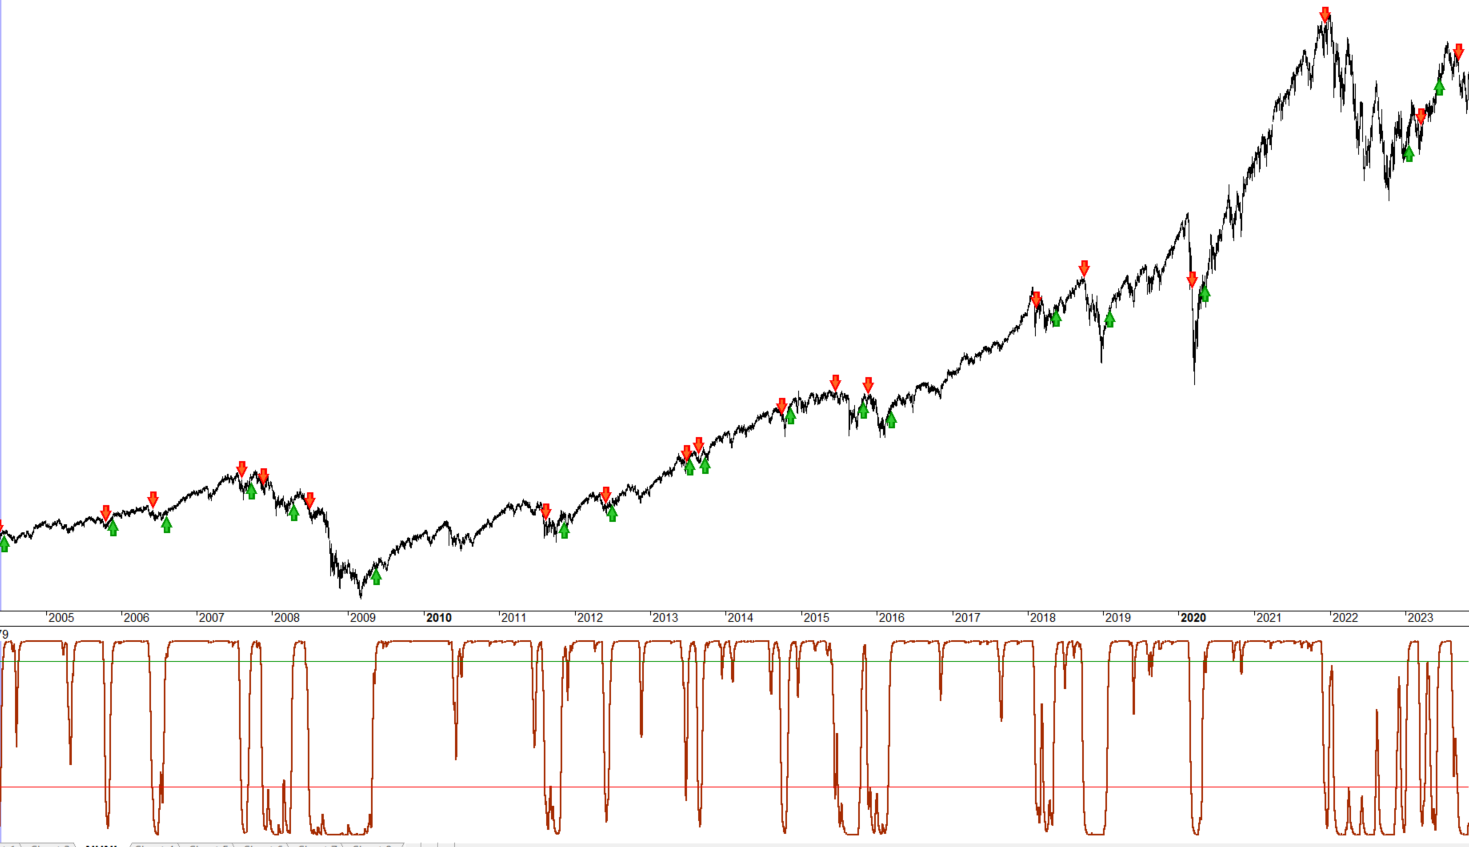
In this approach, it has been implemented an oscillator that offers valuable insights into market conditions. This oscillator serves to identify overbought and oversold conditions, enabling traders to make well-informed decisions regarding the entry and exit of long positions. The oscillator provides a nuanced perspective on market dynamics, enhancing our ability to navigate the complexities of the financial markets.
New Highs-New Lows Oscillator
Note: The formula for calculating the oscillator, is intentionally omitted from this publication. The objective is not to provide detailed formulas but to underscore the importance of New Highs (NH) and New Lows (NL) in offering valuable insights for investment decision-making. This publication focuses on highlighting the informative nature of NH and NL, steering away from specific details of the oscillator formula.
Fig.3 NH-NL Oscillator open and close signals:
Rules:
Long Side
Open Position: (If the following rules are meted, open position next day at Open)
- Oscillator cross value 90
Close Position:
- Oscillator cross value 25
Short Side:
N/A
Results:
Fig. 4 SPY yearly returns Model vs Buy & Hold:
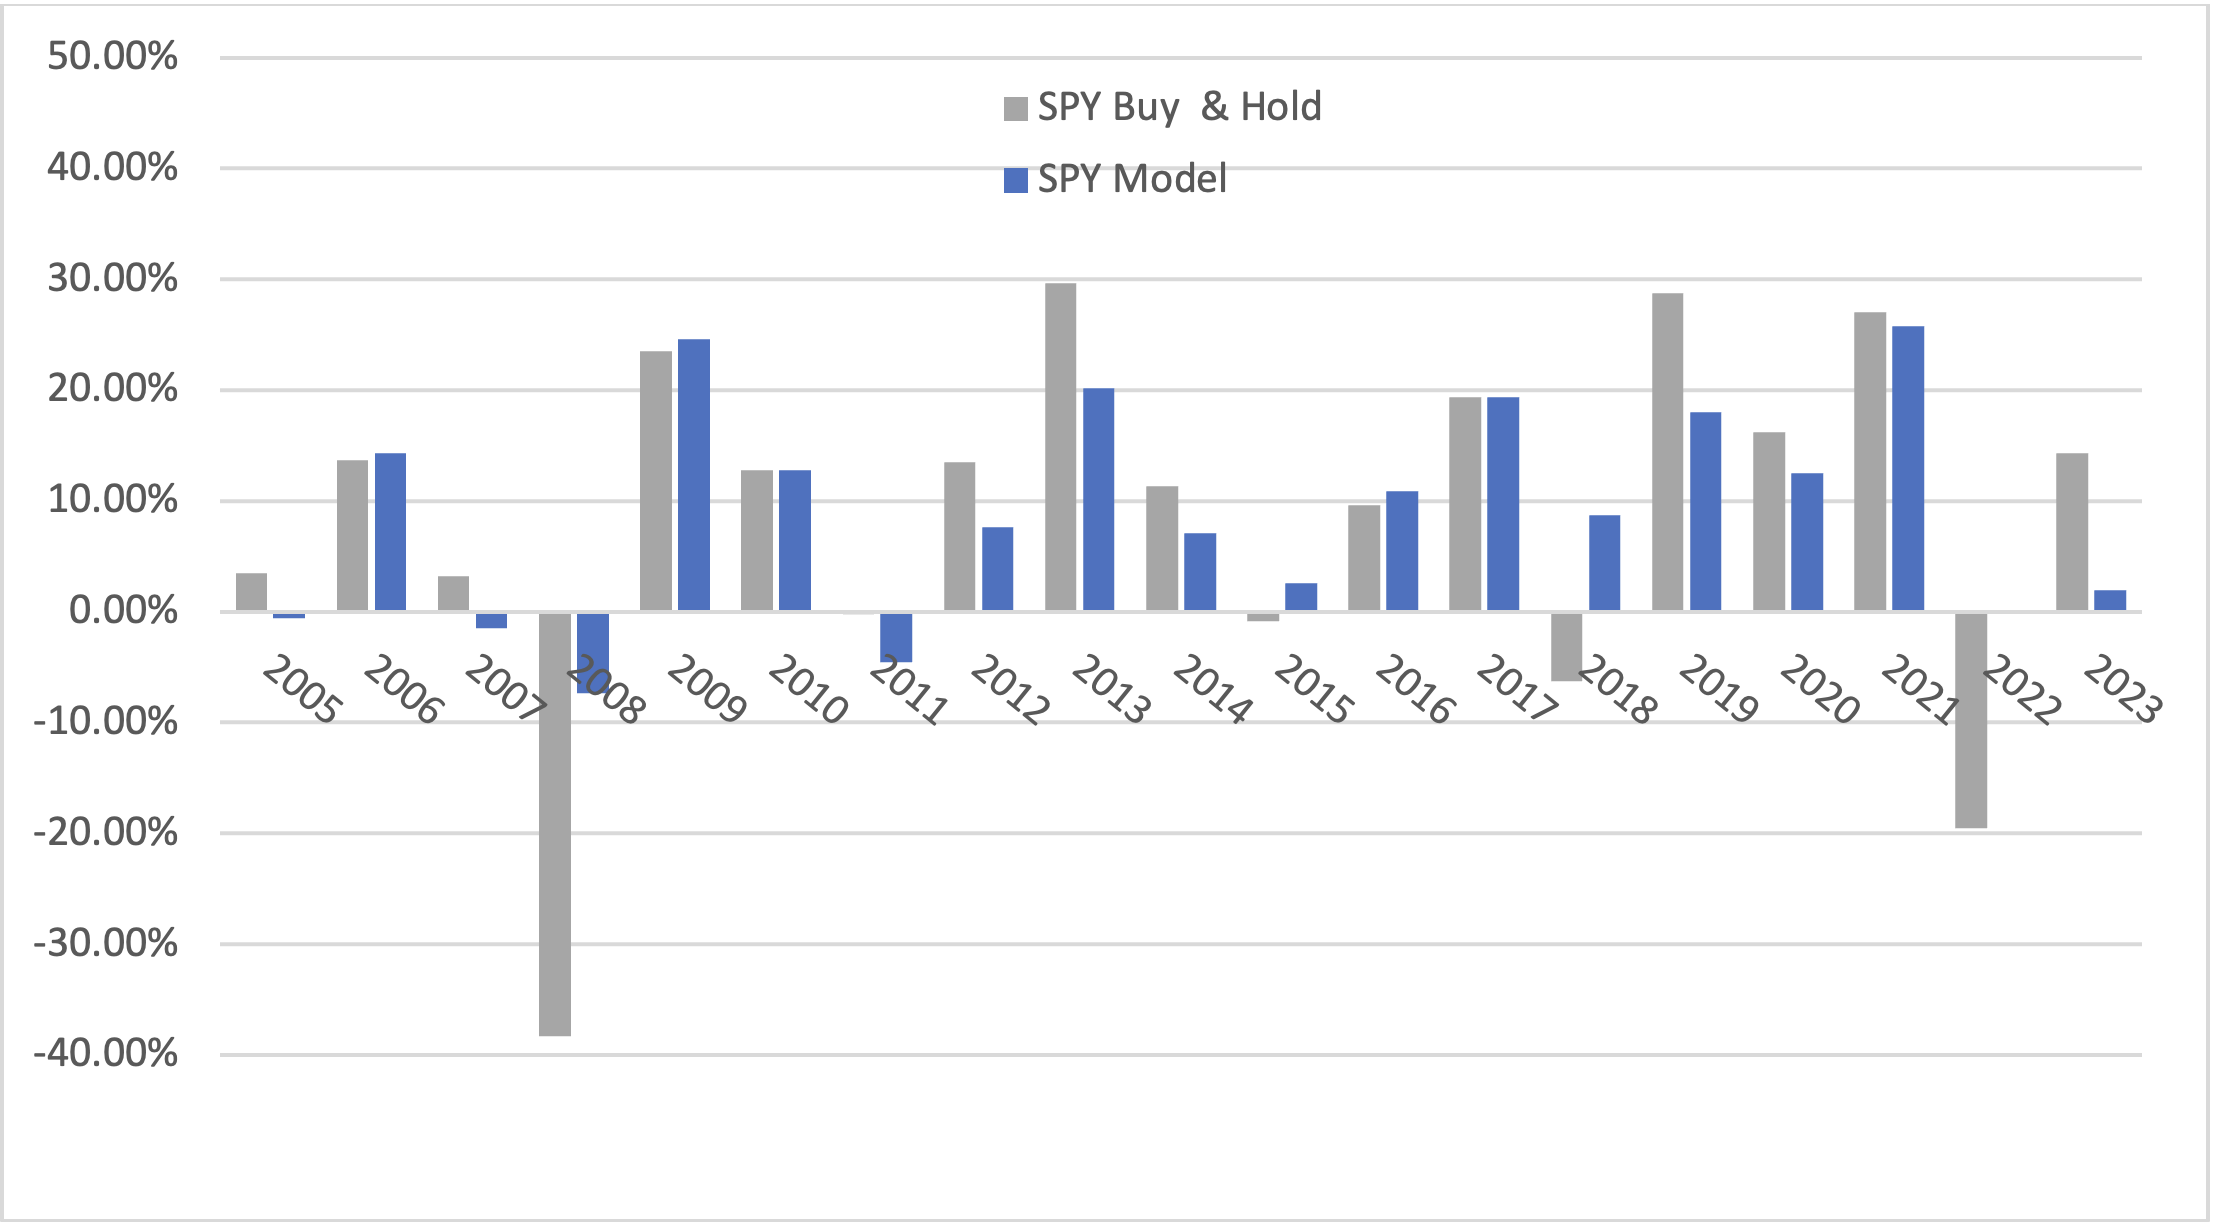
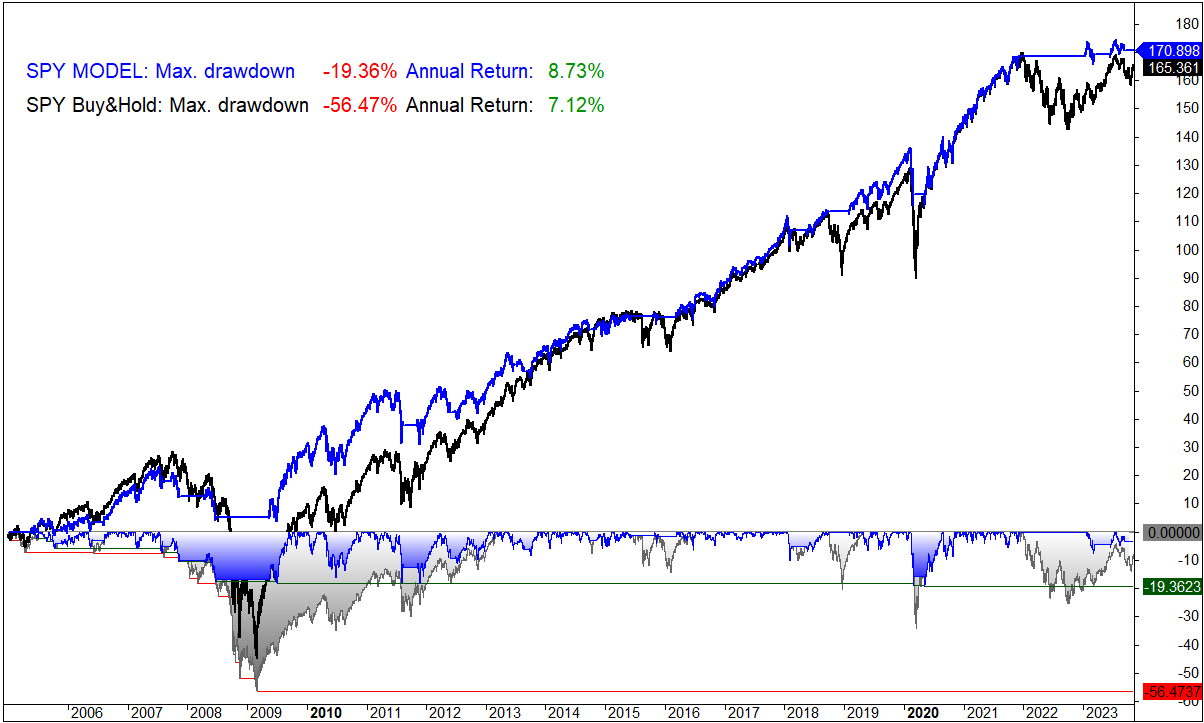
Fig.5 SPY Profit and Draw Down graph Model vs Buy & Hold:
Study 3
Strategic Integration: Maximizing Returns through Combined Models
Upon analysing the results of both studies, the initial thought is that there is potential for a synergistic approach by combining the two models by Operating the long side with Model 2 (Oscillator) and the short side with Model 1 could offer an optimized strategy. This dual-model integration aims to leverage the strengths identified in each study.
The combined model has been backtested with the below assets:
- 100% of the capital allocated to the SPY (benchmark SPY buy & hold)
- 100% of the capital allocated to QQQ (benchmark QQQ buy & hold)
- 50% of the capital allocated to SPY and 50% to QQQ (benchmark 50% SPY -50%QQQ Buy &hold)
Results 100% SPY:
Fig. 6 SPY yearly returns Combined Models vs Buy & Hold:
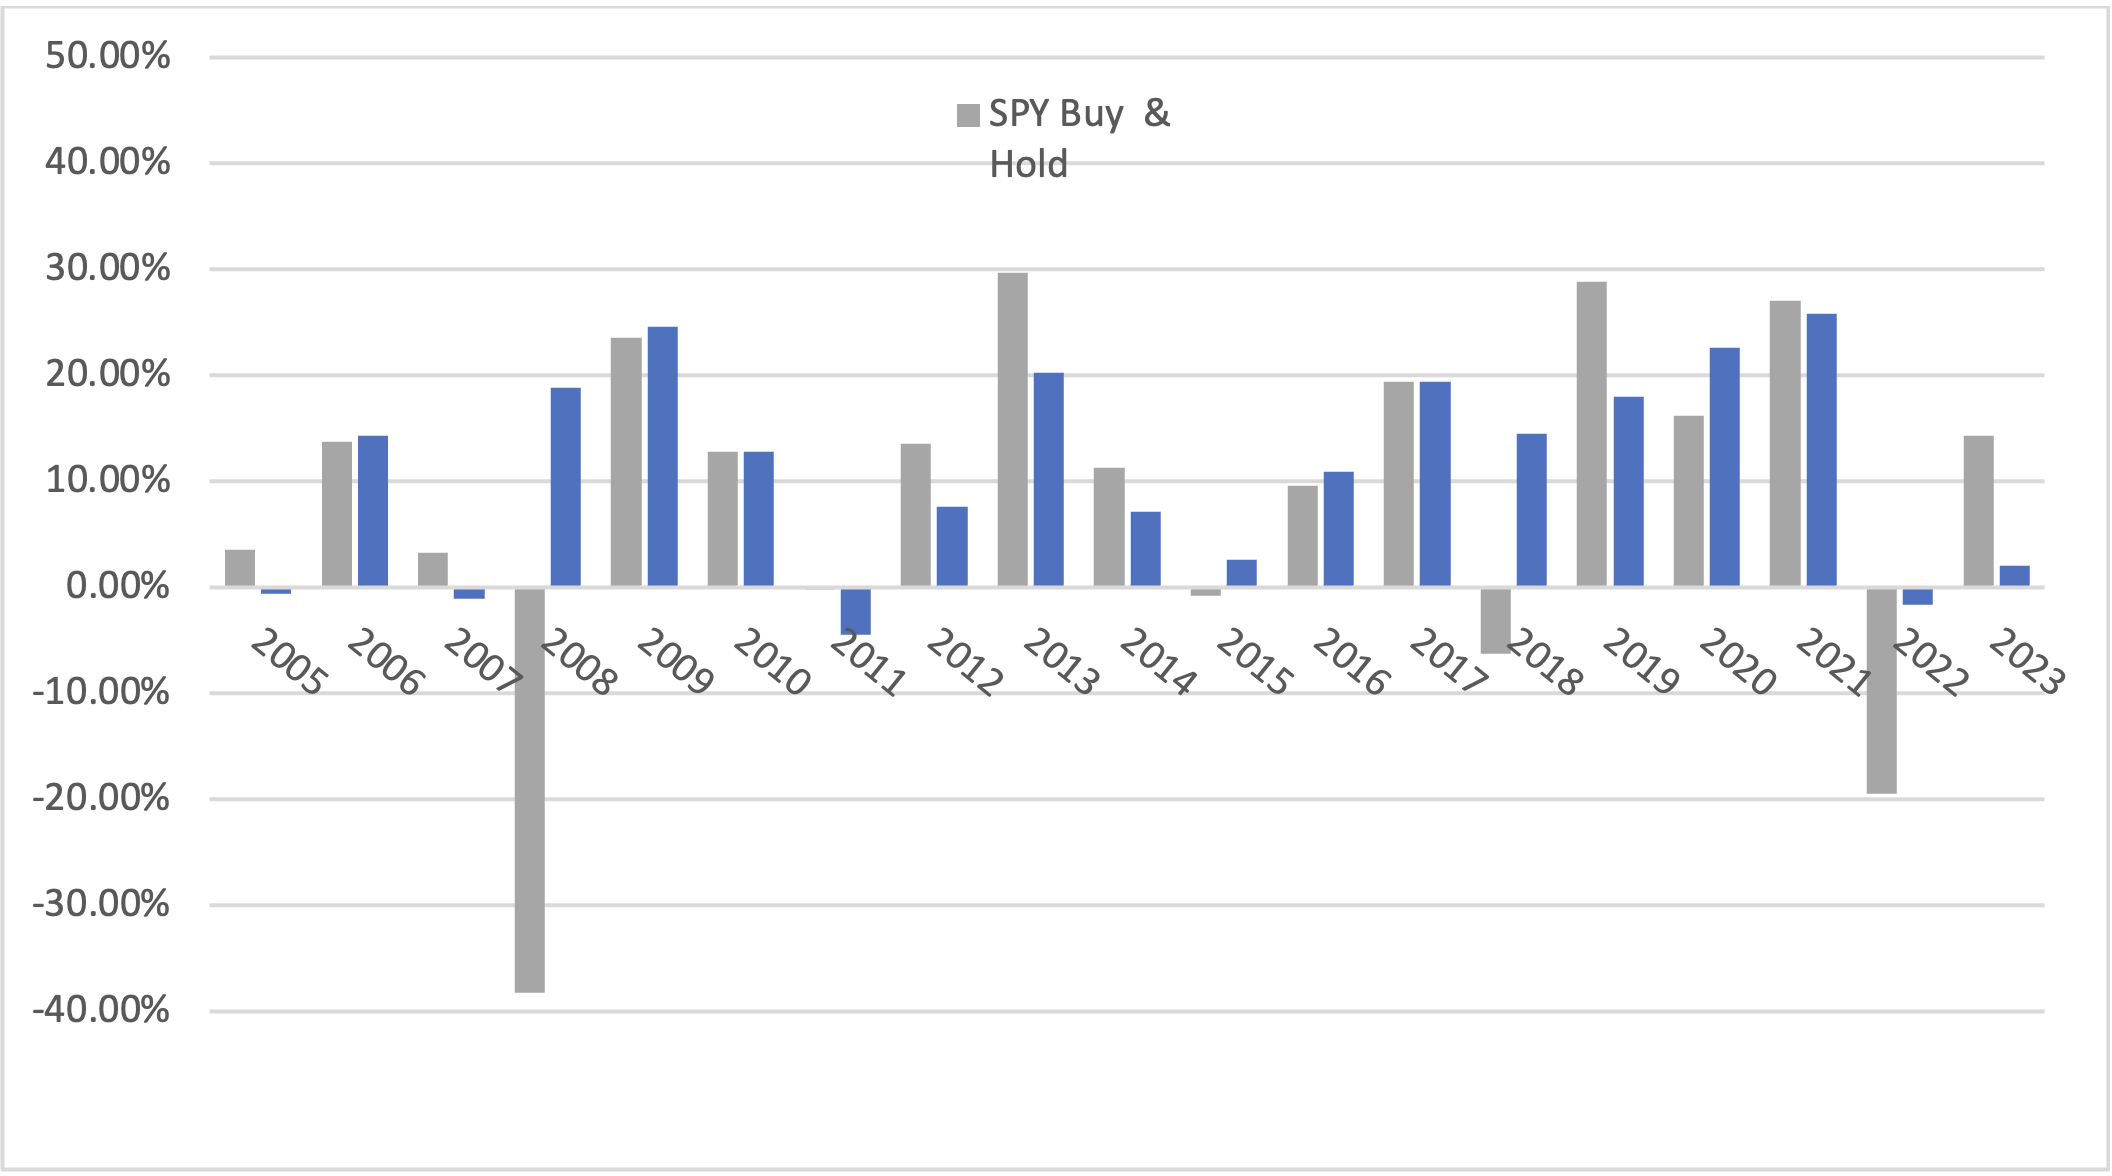
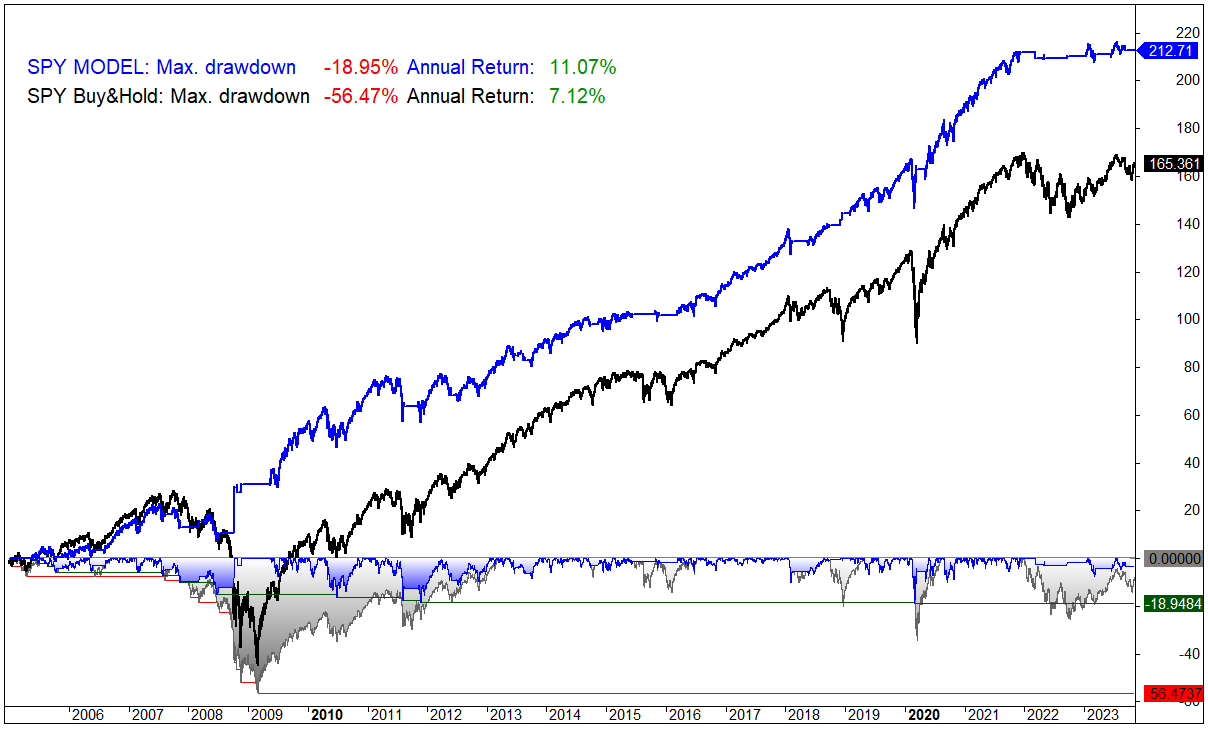
Fig.7 SPY Profit and Draw Down graph Combined Model vs Buy & Hold:
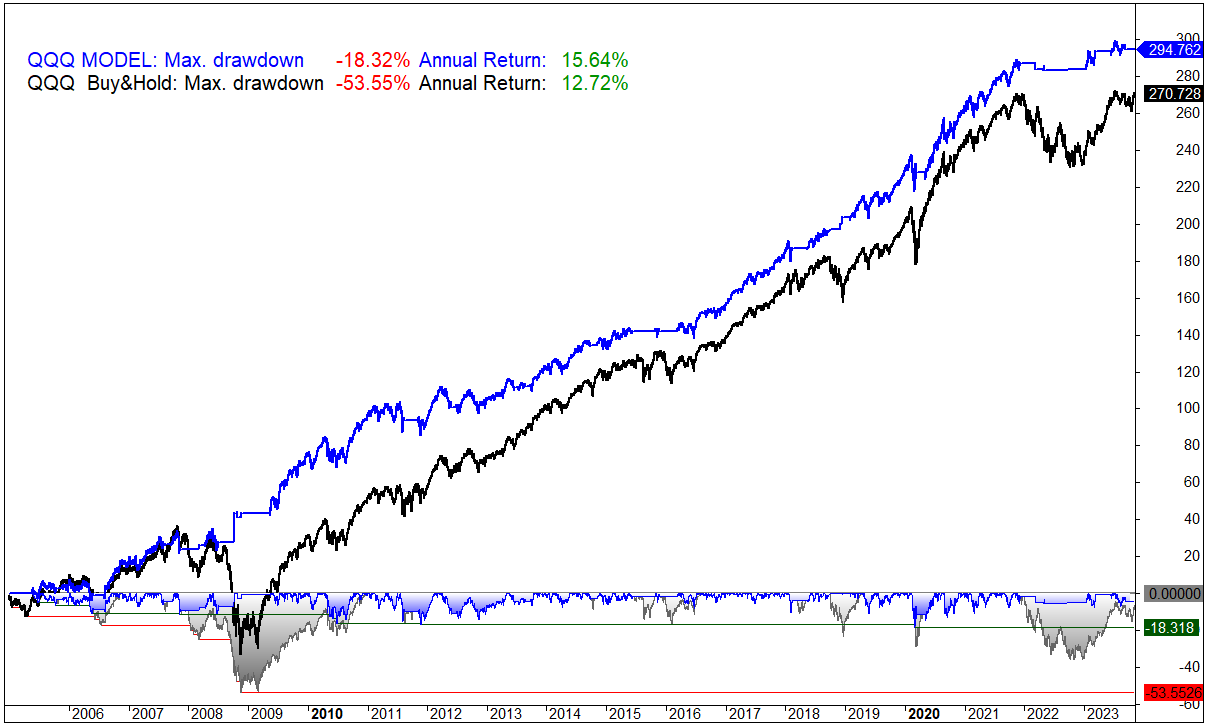
Results 100% QQQ:
Fig. 8 QQQ yearly returns Combined Models vs Buy & Hold:
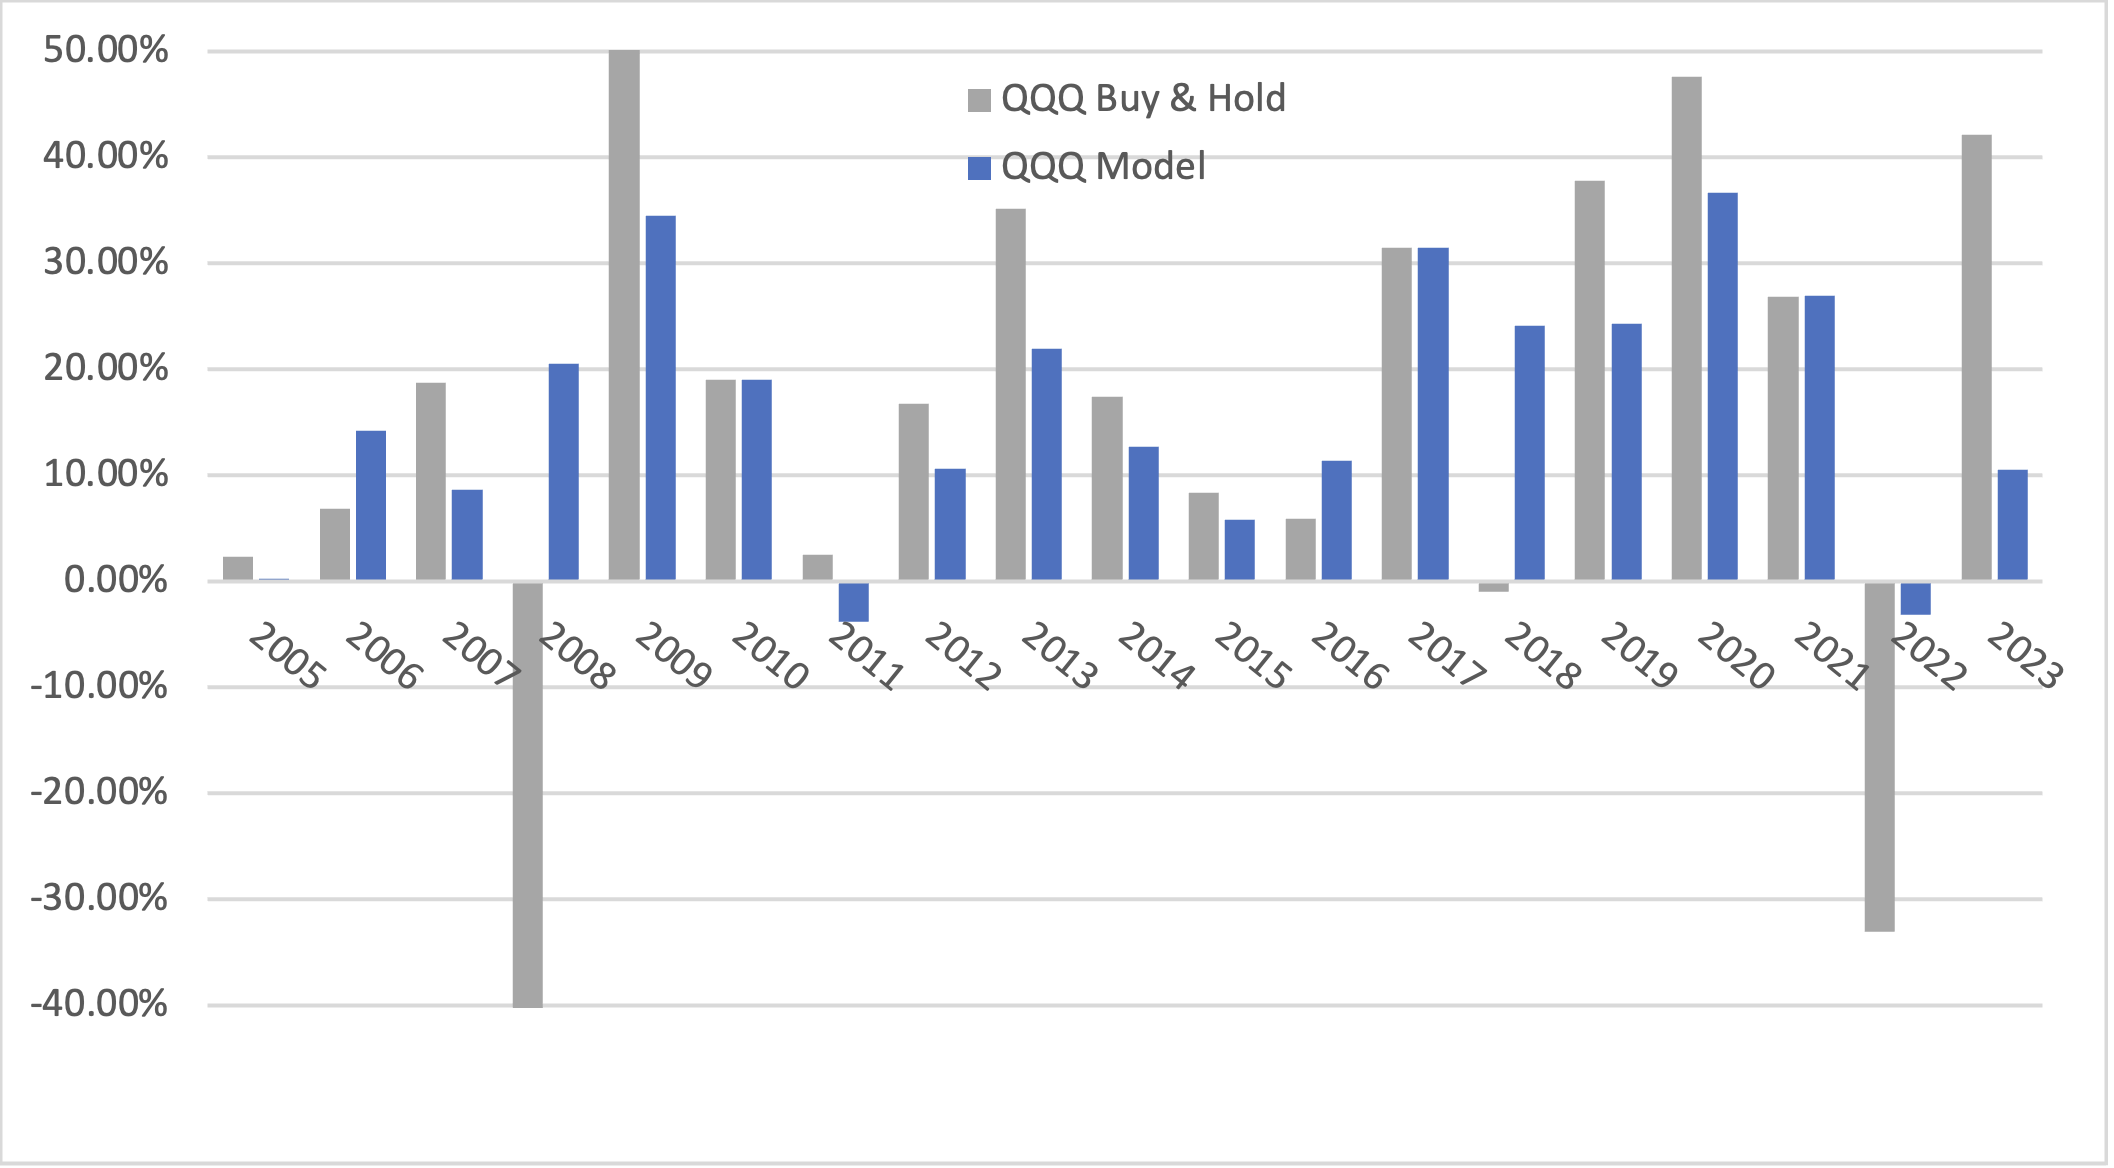
Fig.9 QQQ Profit and Draw Down graph Combined Model vs Buy & Hold:
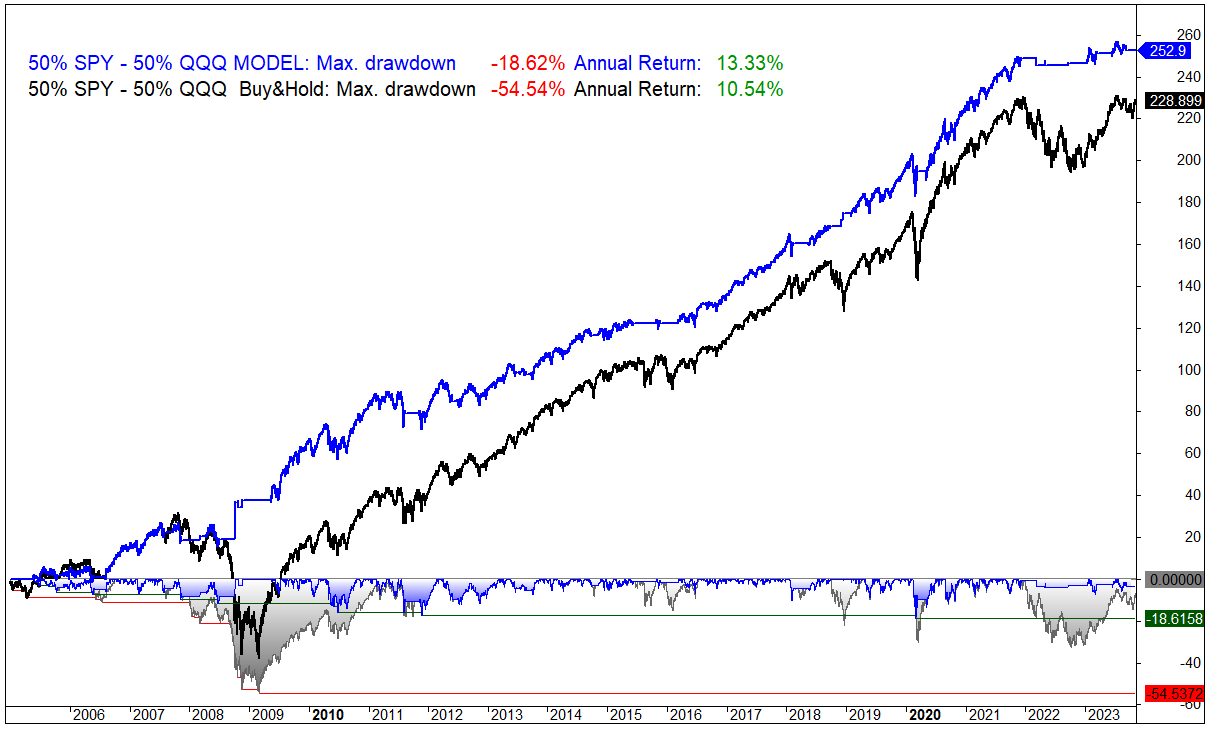
Results 50% QQQ – 50% SPY:
Fig. 10 50% SPY – 50% QQQ yearly returns Combined Models vs Buy & Hold:
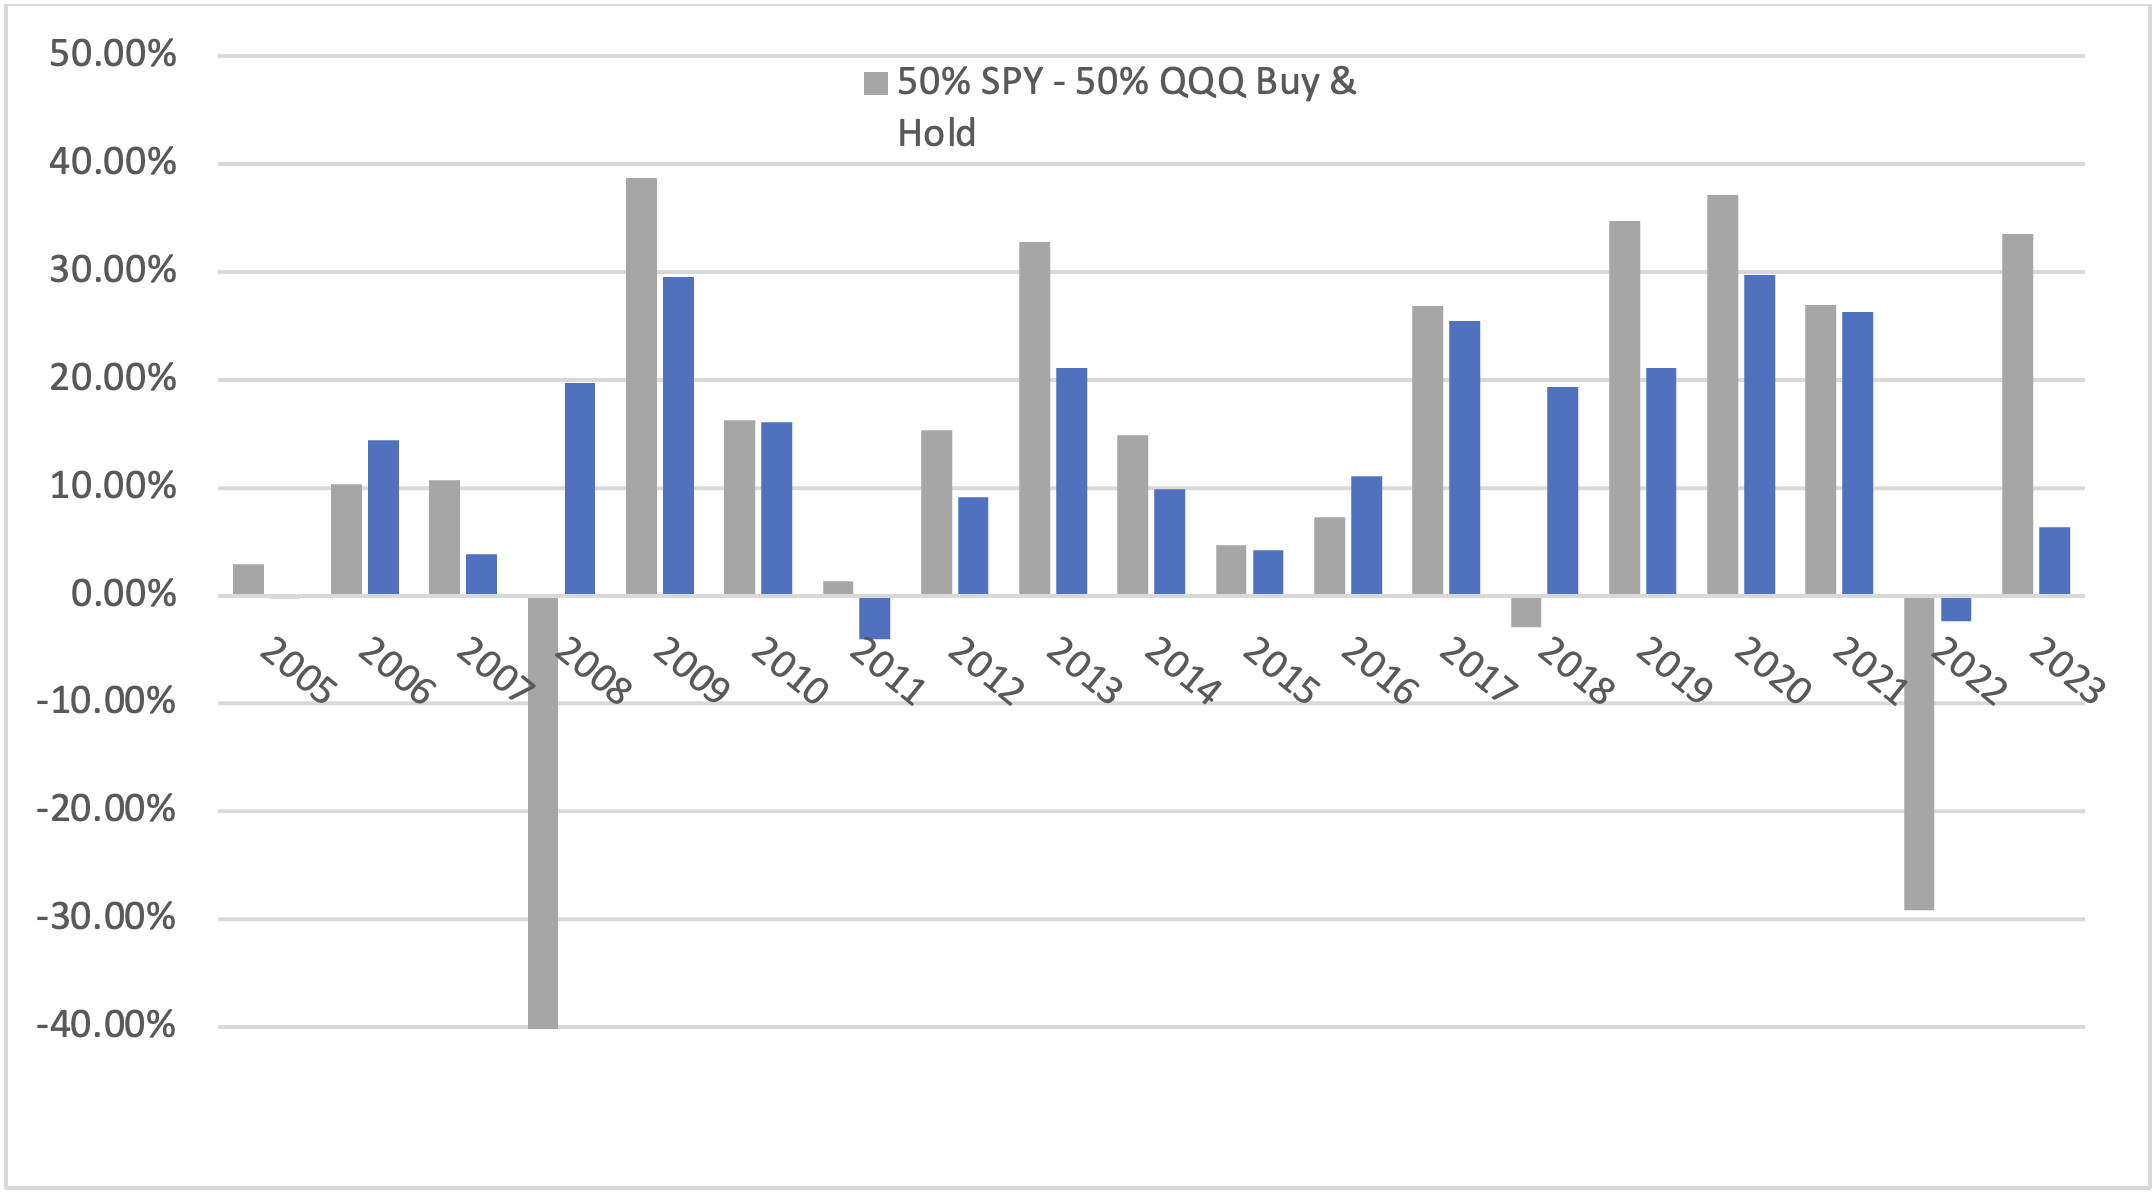
Fig.11 50% SPY – 50% QQQ Profit and Draw Down graph Combined Model vs Buy & Hold:
Reliability and Diverse Applications
To assess the reliability of the Combined model, aside from conducting backtesting exercises with SPY and QQQ, two additional backtests were run. The first involved the ETF XLY, while the second employed a portfolio of individual stocks.
These supplementary tests were conducted to evaluate the model's performance across different market conditions and asset classes, providing a more comprehensive understanding of its robustness. The results of these additional backtests validate the model’s reliability and its potential to identify market movements.
Utilizing the Indicator with the ETF XLY (Consumer Discretionary Select Sector SPDR Fund)
The ETF XLY refers to the Consumer Discretionary Select Sector SPDR Fund, an exchange-traded fund designed to track the performance of the consumer discretionary sector in the U.S. stock market. This sector encompasses companies whose products and services are considered non-essential, often tied to economic prosperity and discretionary consumer spending.
Companies operating in the consumer discretionary sector typically offer goods and services that consumers purchase when they have discretionary income, as these items are not considered necessities. Examples include clothing, electronics, entertainment, and travel services. During periods of economic growth and when consumers have more disposable income, there is often an increased demand for products and services from this sector.
Therefore, if the XLY ETF is moving in the direction of the stock market, it could indicate that the consumer discretionary sector is performing well, and companies within this sector are generating positive results. Movements in the XLY ETF can serve as a general indicator of economic health and discretionary spending trends.
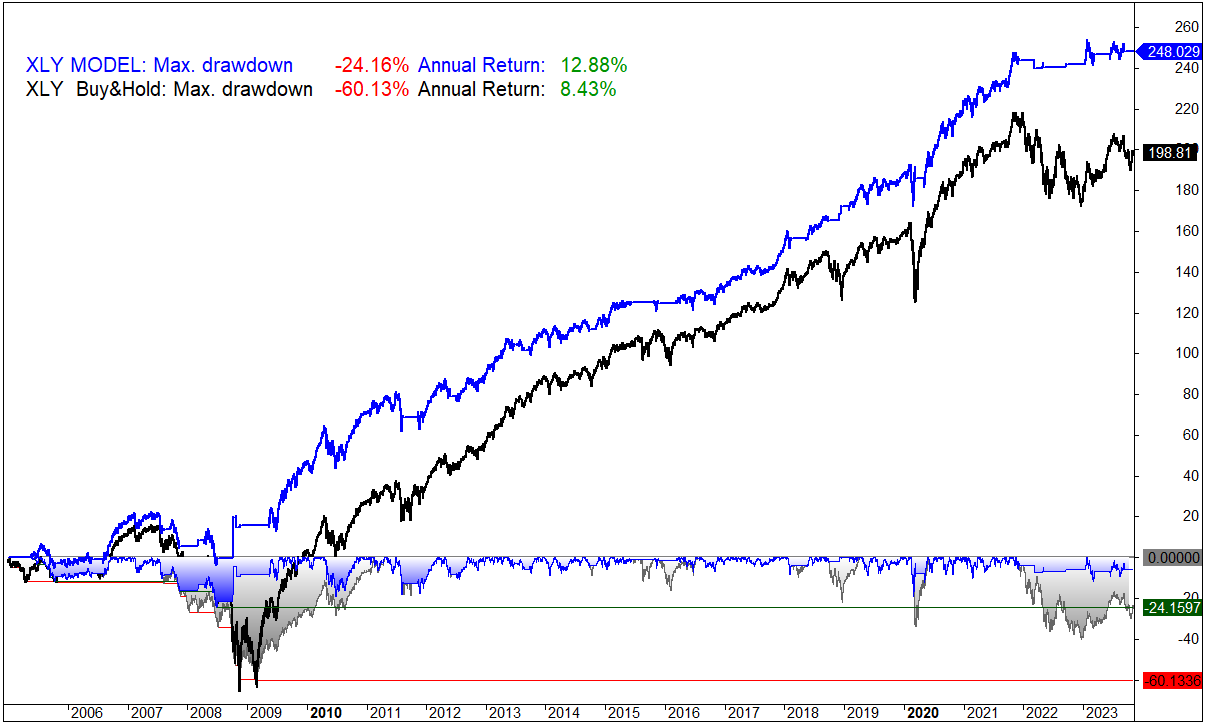
Results XLY:
Fig. 12 XLY yearly returns Combined Models vs XLY Buy & Hold:
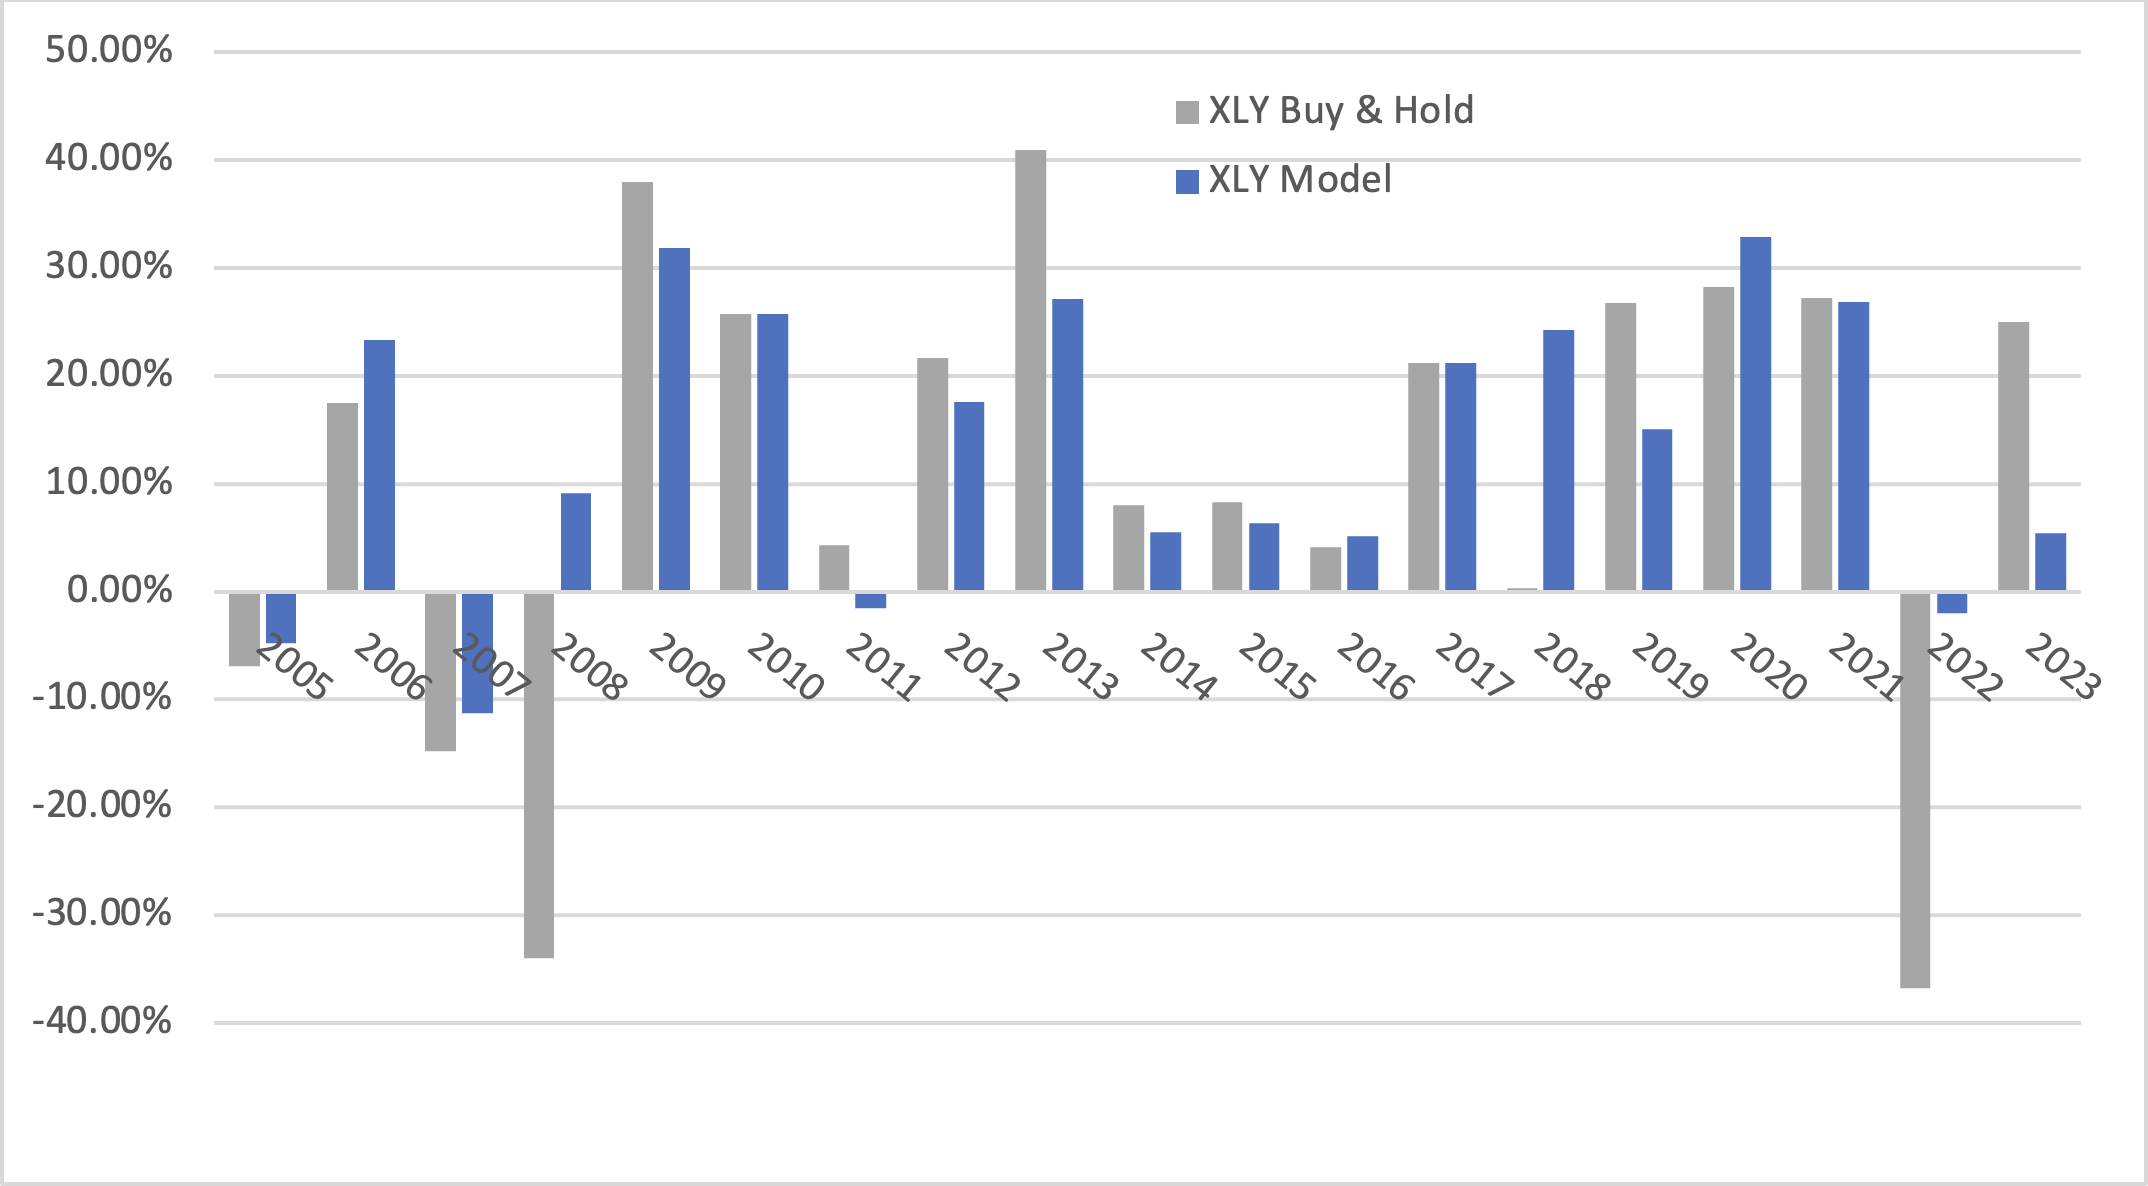
Fig.13 XLY Profit and Draw Down graph Combined Model vs XLY Buy & Hold:
Utilizing the Indicator with a Portfolio of Stocks
In this study, we employ the indicator in conjunction with a portfolio of stocks. This approach allows us to assess the effectiveness of the indicator in real-world conditions and observe its influence on the performance of a specific set of stocks. The selection of stocks in the portfolio offers a practical framework for comprehending the applicability and practical implications of the indicator within the context of a diversified investment.
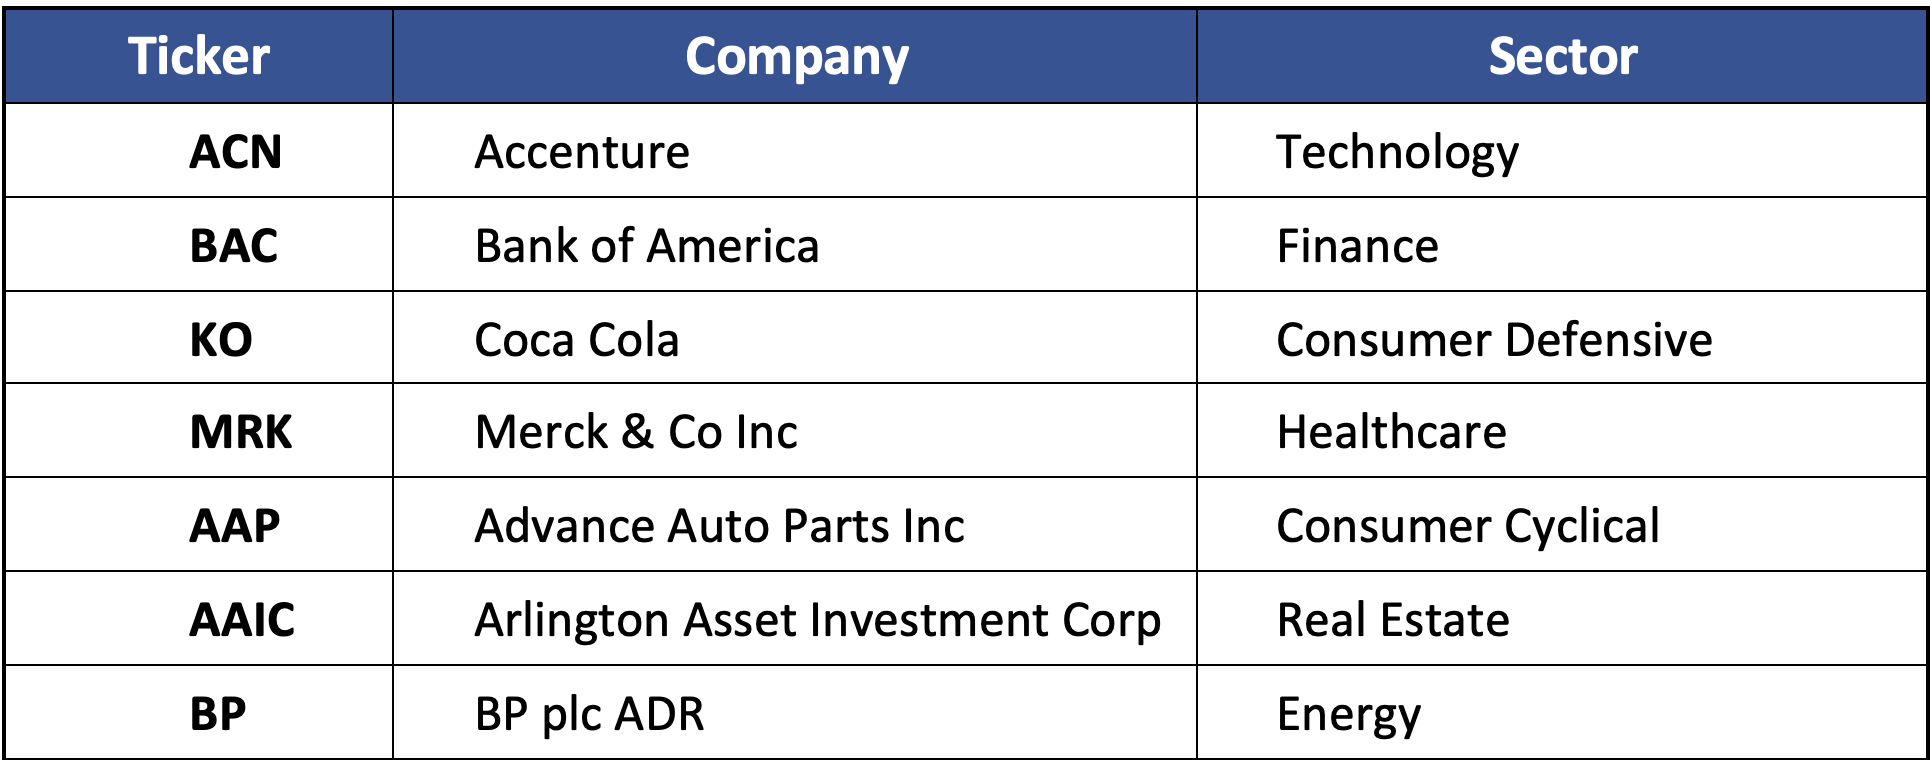
In the formulation of the portfolio, it has been selected the below 7 stocks, attaining to diversify across multiple sectors.
Results Portfolio of Stocks:
Fig. 14 Portfolio of Stocks yearly returns Combined Models vs Portfolio Buy & Hold:
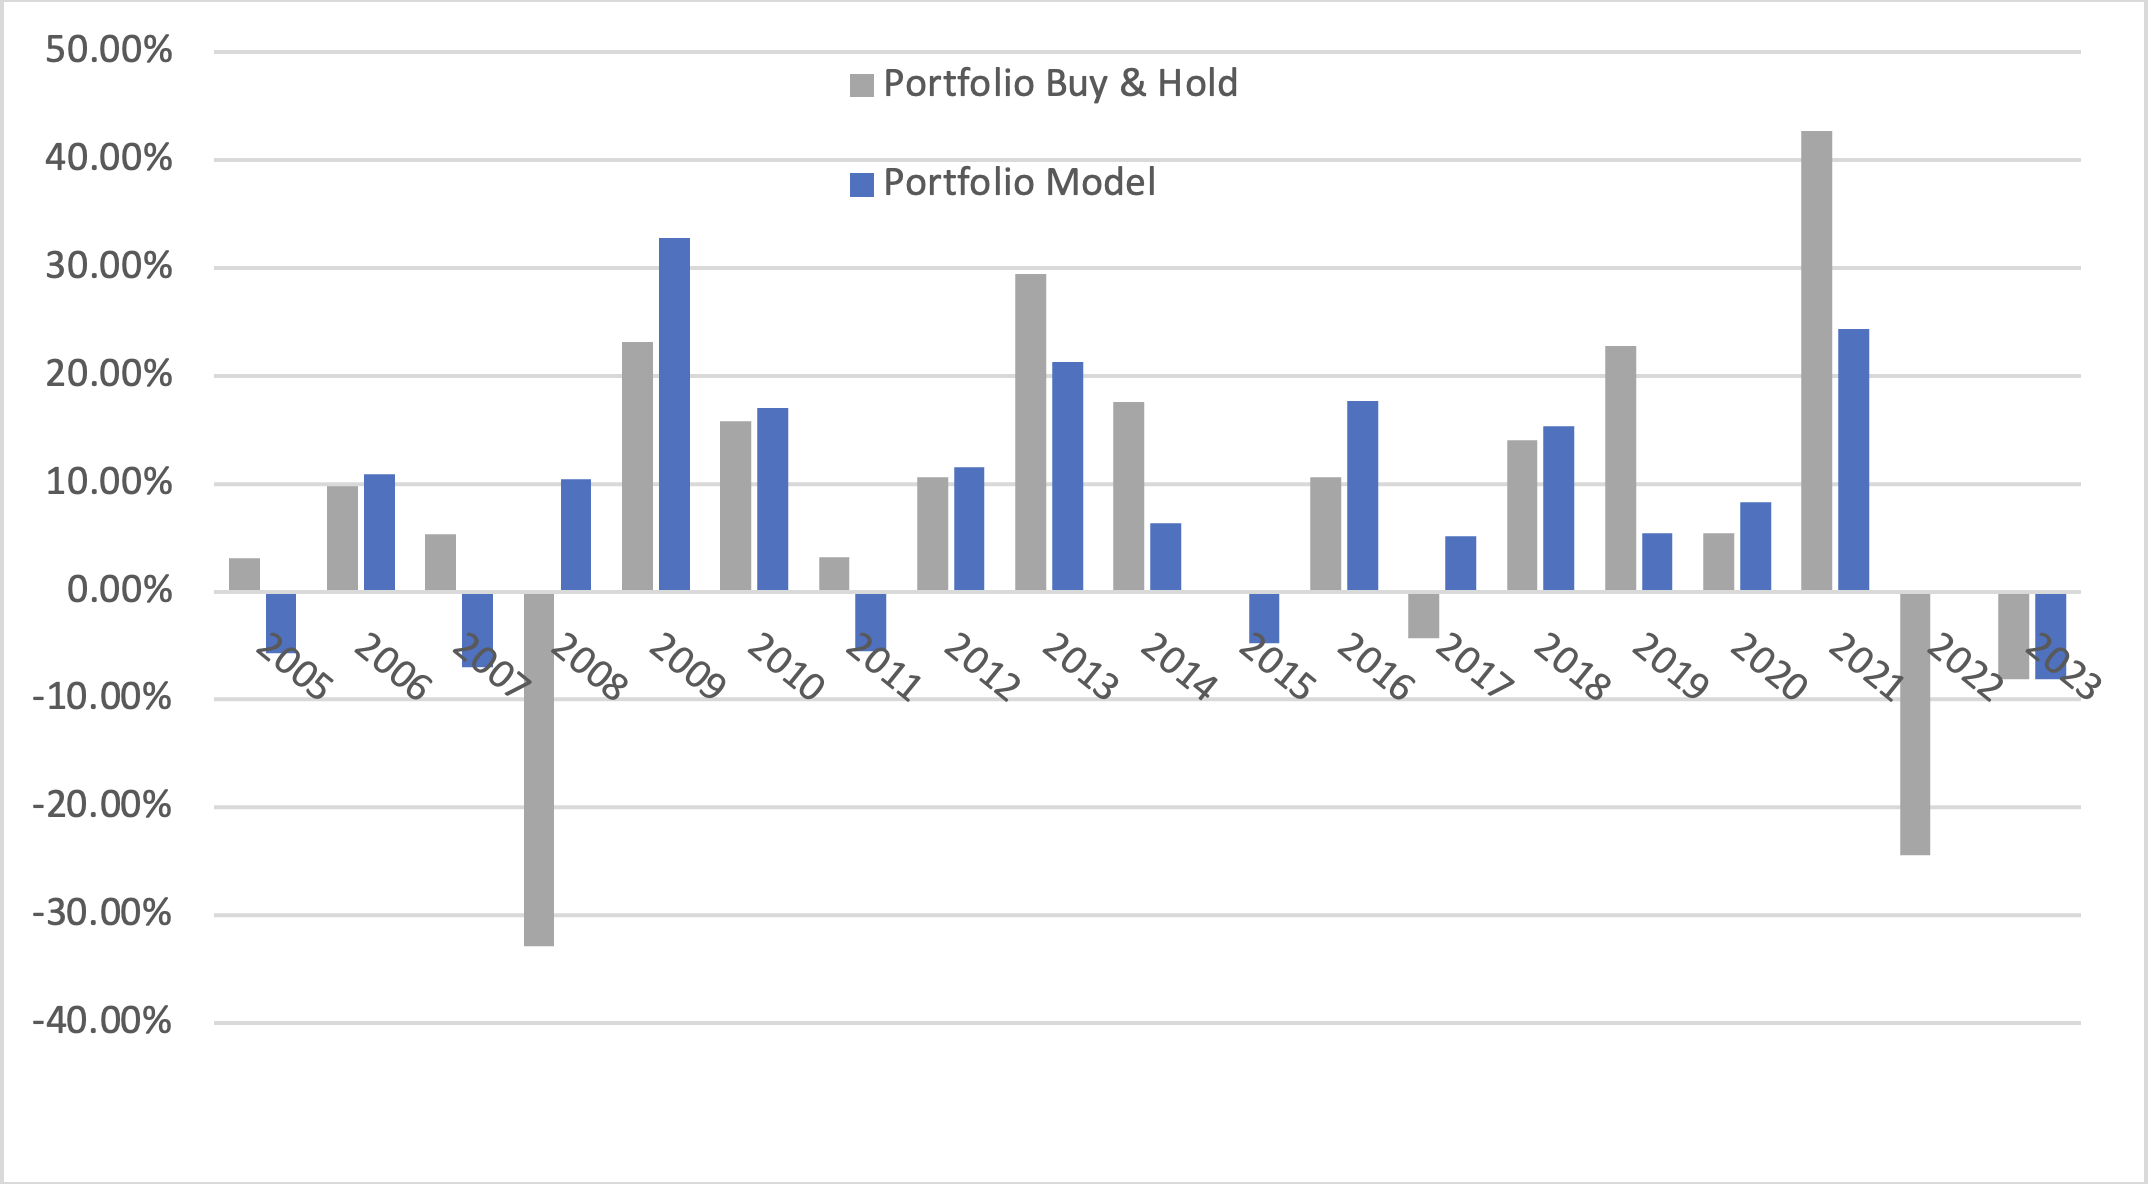
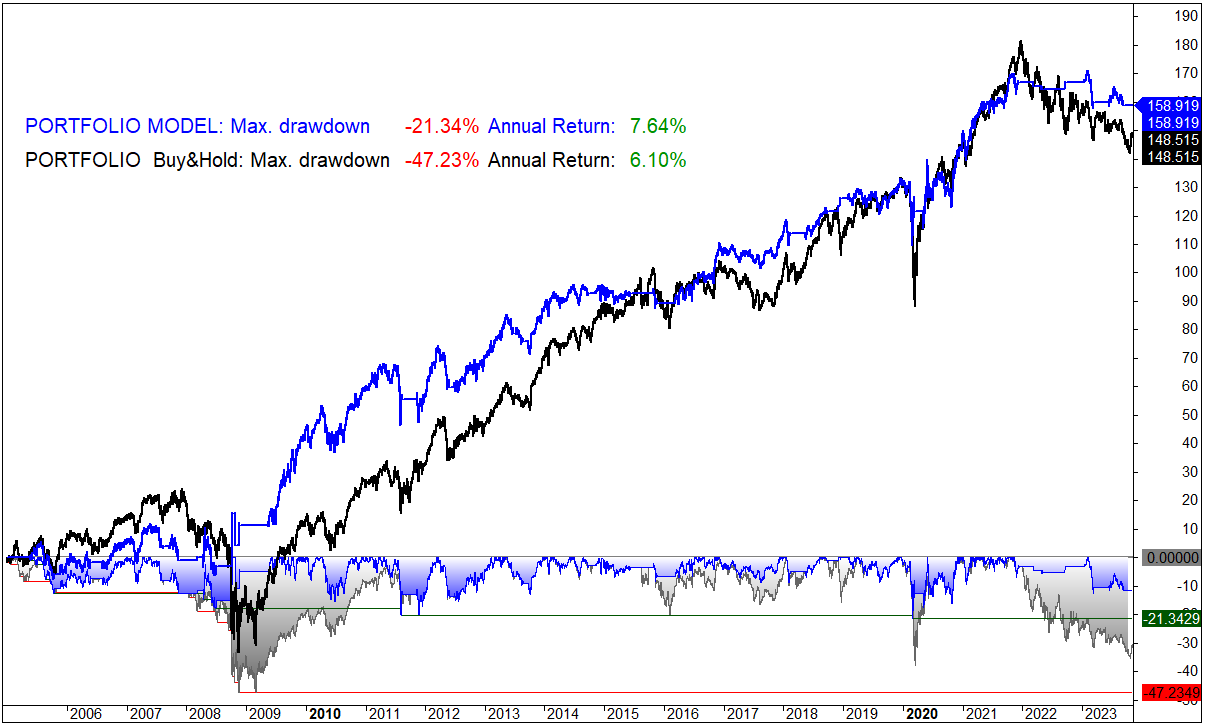
Fig.15 Portfolio of Stocks Profit and Draw Down graph Combined Model vs Portfolio Buy & Hold:
Conclusion
Exploring the New Highs (NH) and New Lows (NL) data from the NYSE reveals valuable information when making investment decisions. While it is advised not to solely rely on this indicator, incorporating NH-NL data, proves to be a beneficial complement to existing tools in the decision-making toolbox.
The information provides by the NYSE NH-NL, contributes to a more comprehensive understanding of market dynamics. This additional information provides investors with valuable information about the market direction.