Abstract
This paper presents a comprehensive analysis of a trading system specifically developed to assess the reliability of the NYSE New Highs-New Lows indicator, as outlined in the paper titled "A practical application of using NYSE NH NL to overperform the SP500" (The original paper could be accessed through the following link: papers.ssrn.com/sol3/papers.cfm )
The system operates on historical data of the ETF QQQ from March 1999 to the present, sourced from Yahoo Finance. Employing three proprietary indicators, with the Nyse New Highs-New Lows indicator being the primary focus, our study aims to demonstrate the robustness and consistency of this trading strategy.
Introduction
The trading strategy presented in this paper is implemented on the QQQ ETF, or Invesco QQQ Trust, is an exchange-traded fund that tracks the performance of the Nasdaq-100 Index. This ETF is designed to provide investors with exposure to the 100 largest non-financial companies listed on the Nasdaq Stock Market, which includes many technology and internet-related companies. The QQQ ETF is one of the most widely traded and recognized ETFs in the world.
The Nyse New Highs-New Lows indicator, mentioned in this paper, serves as the cornerstone of our trading system. To enhance its effectiveness and reliability, we complement it with two proprietary indicators derived from Nyse Advanced Declines, Nyse NH NL, and Nasdaq Volume Advanced and Decline. While the specific formulas for these indicators are beyond the scope of this paper, their inclusion is crucial for a holistic evaluation of our trading strategy.
Methodology
The trading system implemented in this study involves the generation of open and close signals, with actual execution occurring at the close of the market.
The positions are then initiated or liquidated on the next trading day at the opening market price.
Data Splitting:
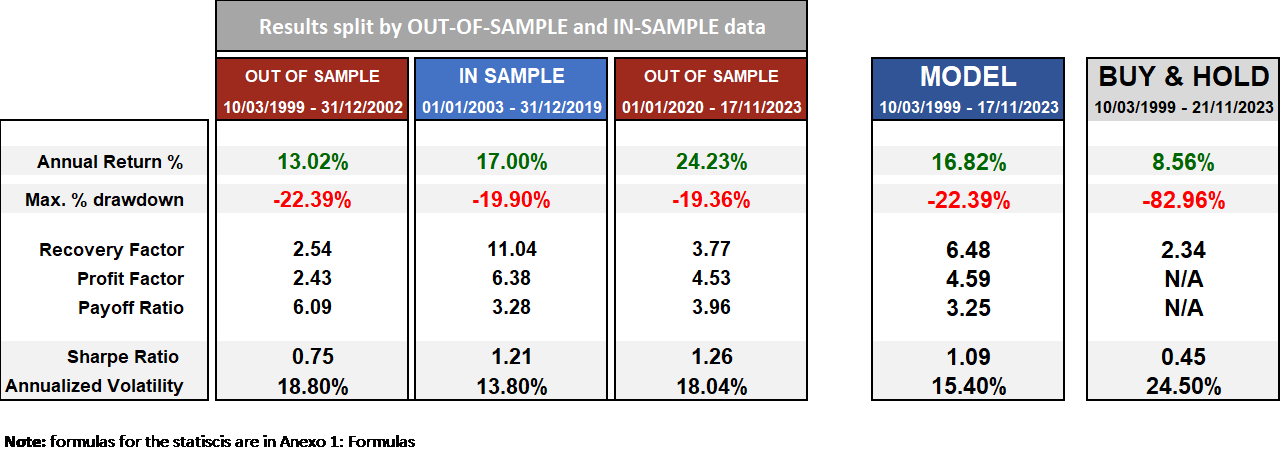
To ensure the robustness and reliability of the trading system, the historical data of the QQQ ETF from March 1999 to November 2023 was divided into in-sample and out-of-sample sets.
- The in-sample data, crucial for develop the model, encompasses the years 2003 to 2019.
- The out-of-sample data, utilized for unbiased model evaluation, spans two distinct periods: from 1999 to 2002 and from 2020 to 2023.
This intentional division allows us to assess the model's performance across different market conditions and timeframes, providing a comprehensive understanding of its effectiveness and consistency.
Signal Generation:
The open and close signals are derived from the proprietary indicators, with a primary focus on the Nyse New Highs-New Lows indicator as outlined in the paper "A practical application of using NYSE NH NL." The combination of this indicator with additional proprietary metrics based on Nyse Advanced Declines, Nyse NH NL, and Nasdaq volume advanced and decline refines the signal generation process.
Execution:
The signals for the trades are generated at the close of the market, with positions either opened or closed at the market's opening price on the next trading day.
This approach is intentionally adopted to provide clear signals and to avoid the need for monitoring the system during trading hours. By executing trades at the opening market price, the process is kept objective, eliminating subjectivity, and ensuring the model remains entirely automated.
Stop Loss Mechanism:
To manage risk, the system incorporates a 5% stop-loss mechanism. If the stop-loss level is reached, indicating a potential adverse market movement, the position is closed at the opening market price on the next trading day. This proactive risk management strategy is designed to limit drawdowns and protect capital.
Results
Fig.1 Performance Metrics Comparison: In-Sample vs. Out-of-Sample and Model vs Buy and Hold

Fig.2 Table with the Annual Returns Model vs Buy & Hold:

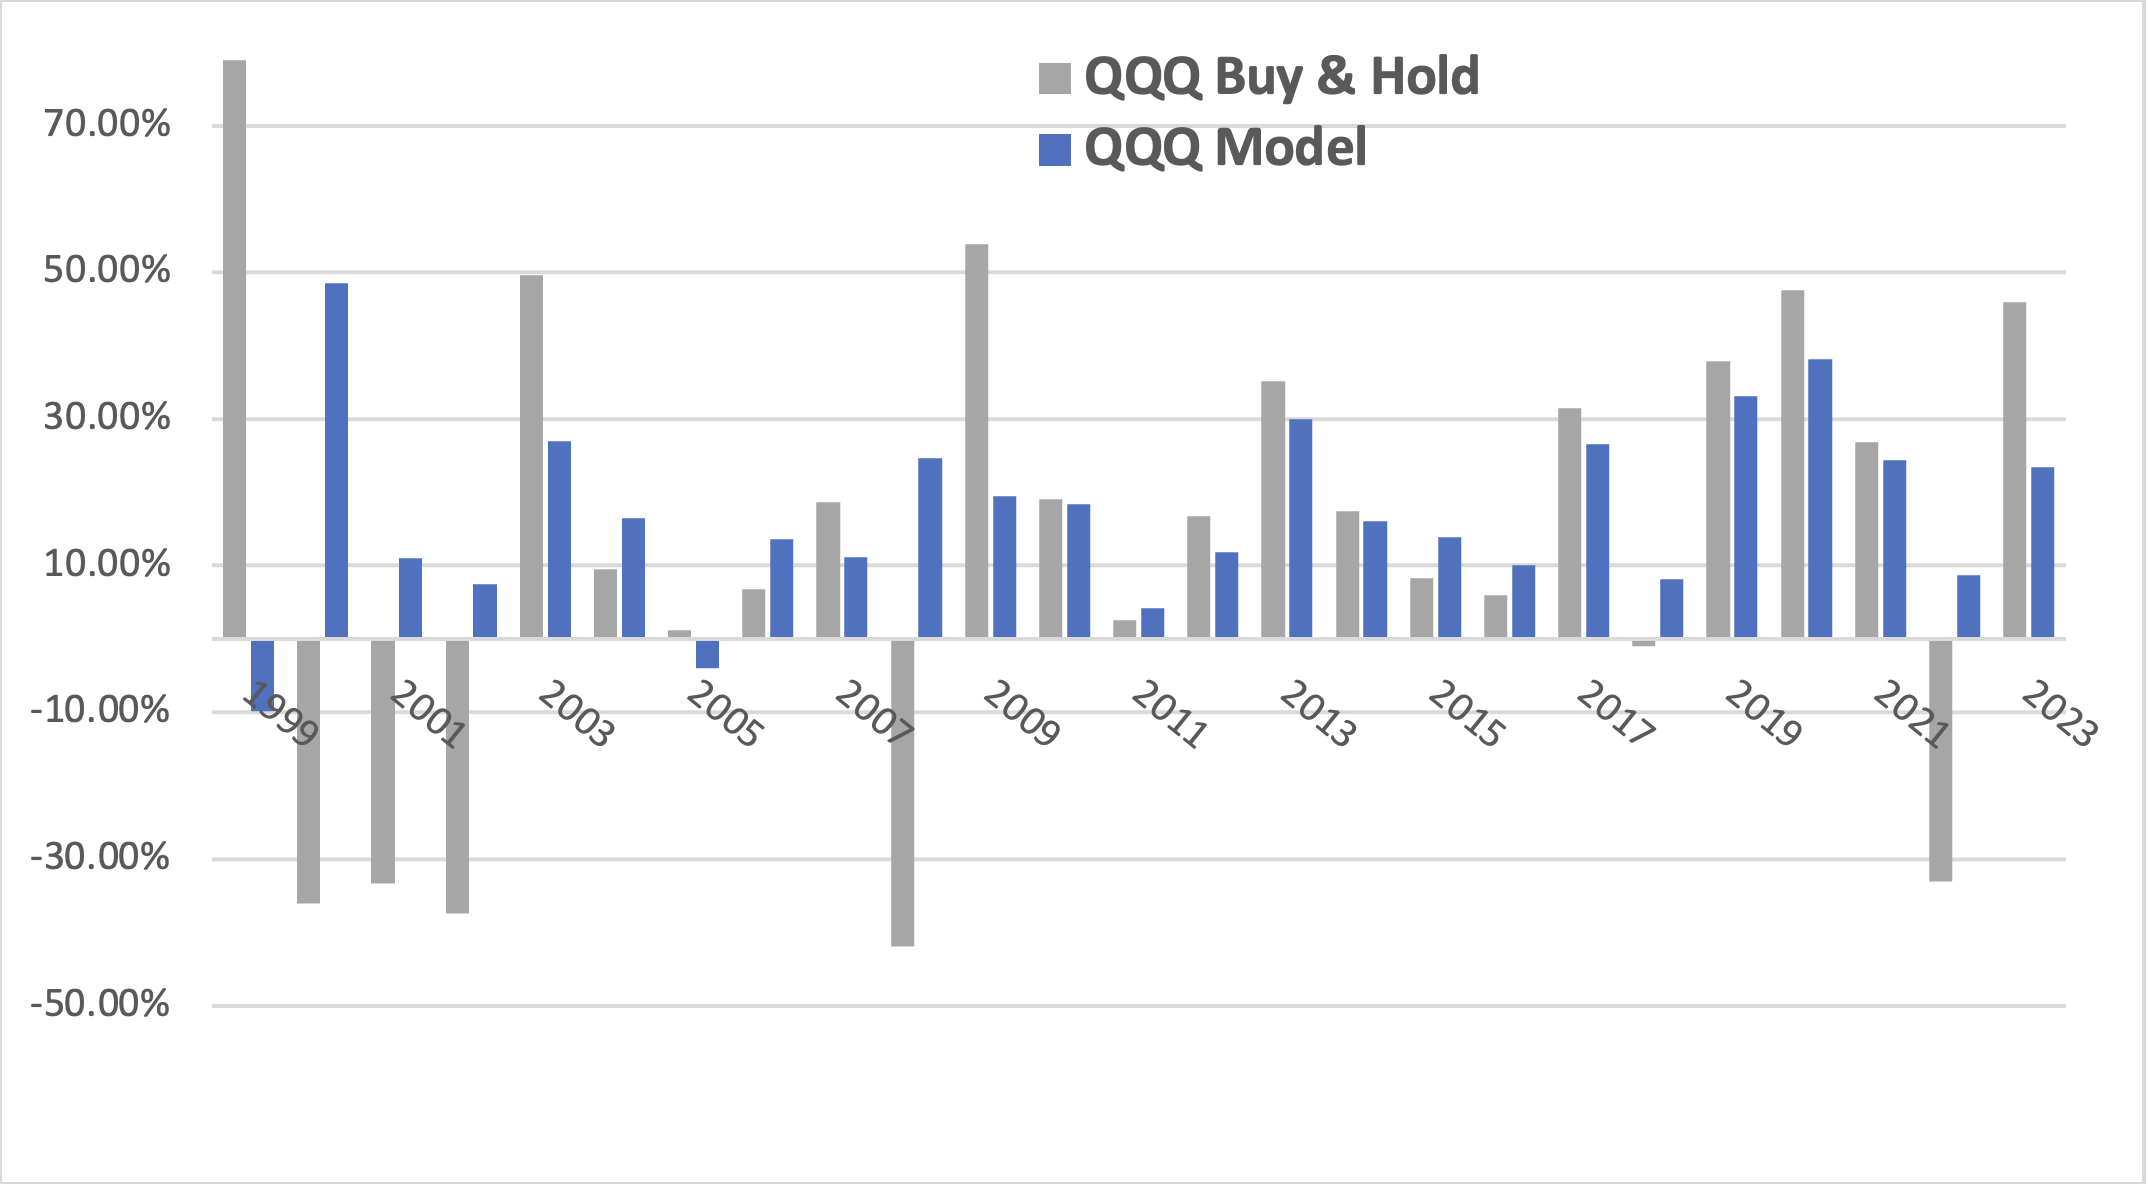
Fig. 3 QQQ yearly returns Model vs Buy & Hold:

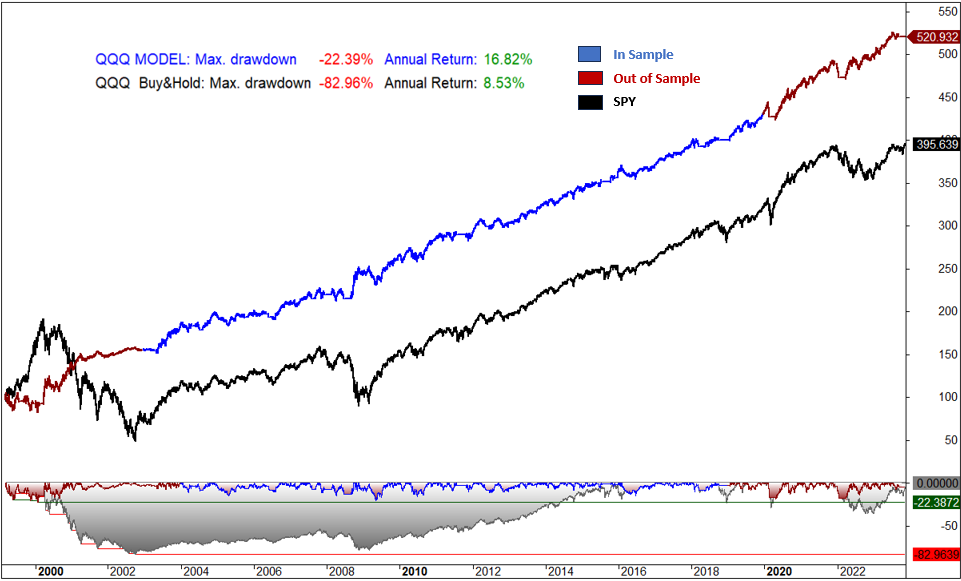
Fig.4 QQQ Profit and Draw Down graph Model vs Buy & Hold:

Results summary:
The performance of the system demonstrates a consistent winning algorithm over the years. The annual return of 16.82% significantly outperforms the 8.56% return achieved through a buy-and-hold strategy on QQQ. Furthermore, the system boasts a Sharpe ratio of 1.09 compared to the 0.45 Sharpe ratio of the buy-and-hold approach. Notably, the annualized volatility of 15.4% is substantially lower than the 24.50% observed in the buy-and-hold strategy, resulting in a very acceptable risk-reward ratio.
Conclusion
The results suggest that the integration of the Nyse New Highs-New Lows indicator with our proprietary indicators enhances the system's ability to identify profitable trading opportunities. The consistent outperformance compared to the buy-and-hold strategy highlights the potential of this approach for investors seeking a dynamic and risk-adjusted alternative.
In conclusion, our system demonstrates the robustness of the Nyse New Highs-New Lows indicator in the context of QQQ ETF trading. The combination of proprietary indicators with the NYSE NH-NL to provide trading signals, results in a consistent winning algorithm, offering investors an annual return of 16.82%, a Sharpe ratio of 1.09, and a lower annualized volatility of 15.4%. These findings suggest that the proposed trading system provides a compelling risk-reward proposition for market participants.
Anexo 1: Formulas
Below are the formulas used to calculate the performance metrics:
Annual Return %: The annualized percentage return is a measure of the average annual rate of return on an investment over a specified time period.

Max. system % drawdown: Maximum percentage decline in the value of a trading system from its highest point (peak) to the lowest subsequent point (trough) over a specified period.

Where:
- Peak Value is the highest point in the value of the trading or investment system.
- Trough Value is the lowest subsequent point in the value of the system.
Recovery Factor: Assesses the ability of an investment or trading strategy to recover from losses. It is calculated using the following formula:

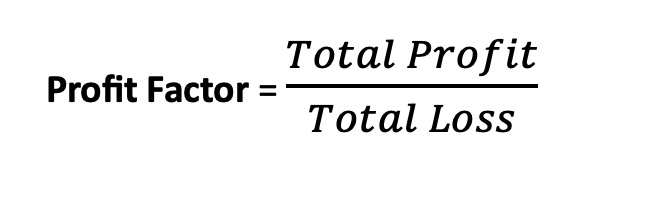
Profit Factor: Measures the profitability of a trading strategy. It is calculated using the following formula:

Payoff Ratio: Also known as the risk-reward ratio, is a financial metric used in investing to assess the potential return of an investment relative to the amount of risk undertaken.

Sharpe Ratio: Is a measure of the risk-adjusted performance of a trading strategy. It helps investors evaluate the return of an investment relative to its risk.

Where:
- Investment Return is the return of the investment or portfolio.
- Risk-Free RateRisk-Free Rate is the return on a risk-free investment.
- Investment Standard Deviation is the standard deviation of the Investment’s returns, which measures the volatility or risk of the portfolio.
Annualized Volatility: Is a measure of the variability of returns of an investment over a one-year period, expressed as a percentage. It is commonly used in finance to quantify the level of risk or uncertainty associated with an investment.
Calculated using Monthly returns:

Where:
- Monthly Volatility is the standard deviation of monthly returns.
- 12 is the number of months in a year.