Abstract
This paper explores the implementation and performance of an asset allocation strategy based on the principles outlined in the "Bold Assets Allocation" strategy allocatesmartly.com/bold-asset-allocation/ .
While the performance of the original BAA strategy did not meet the claimed results in the paper when backtested with Yahoo data from 2004, as demonstrated later in this document in the 'BAA (Original Strategy) Results' section, we have used it as a foundation to develop a new and improved strategy. This enhanced approach incorporates BAA principles, utilizes various market filters to refine portfolio allocation decisions.
Introduction
The field of asset allocation is crucial for optimizing portfolio performance, and the "BAA" paper presented a promising strategy utilizing certain assets as canary to guide offensive or defensive portfolio positioning. Our study replicates the BAA strategy, applying it to Yahoo data from 2004, revealing results inconsistent with the original paper's claims. Undeterred, we have leveraged BAA as a blueprint to develop a more robust and adaptable strategy, incorporating market filters for improved performance.
Implementation Principles
Implementation of BAA Principles:
Our strategy, tentatively named the "Momentum Portfolio Allocation (MPA)", builds upon the BAA concept of using specific assets as leading indicators (canary). By assessing the momentum of these chosen assets, MPA dynamically adjusts the portfolio's risk exposure. When canary assets indicate strength, the portfolio takes an offensive stance, while indications of weakness prompt a defensive posture. This approach aims to capitalize on market trends while protecting against potential downturns.
Market Filters for Enhanced Precision:
Recognizing the need for refinement, we introduce market filters to augment the MPA strategy. These filters, serve to manage position risk, providing an additional layer of capital protection. The incorporation of market filters is a crucial step in addressing the observed performance disparities and ensuring the strategy's adaptability to varying market conditions.
Results and Performance Evaluation:
BAA (Original Strategy)
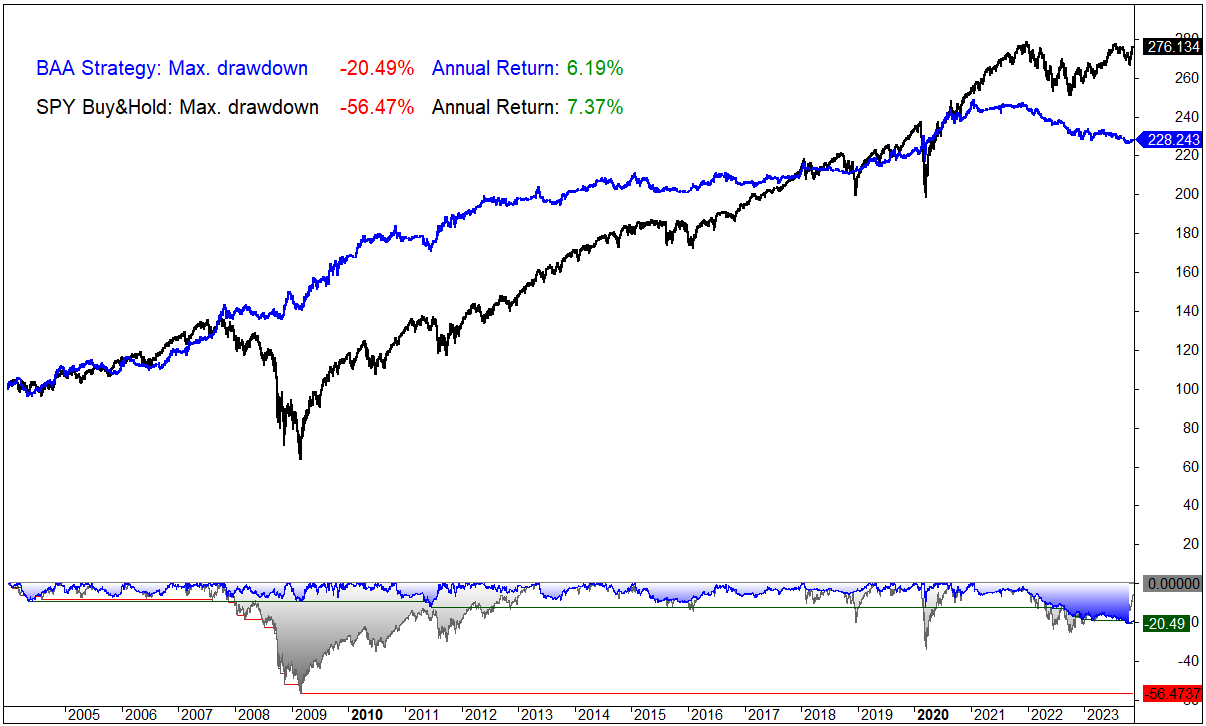
The following results display the outcomes of the Balanced version of the Bold Asset Allocation (BAA) strategy, as outlined in the link provided in the Abstract section of this document. As indicated, the results reveal a performance discrepancy compared to the performance claimed in the BAA strategy description.
As indicated in the BAA strategy description, this strategy is executed at the end of each month, allocating capital to assets exhibiting higher momentum. The allocation decision is dynamic, aligning with either defensive assets or offensive assets positions based on the momentum of the assets that form the canary.
Notably, a decline in performance becomes apparent after 2020, warranting a closer examination of the strategy's adaptability and effectiveness in evolving market conditions.
Fig.1 BAA strategy monthly returns:
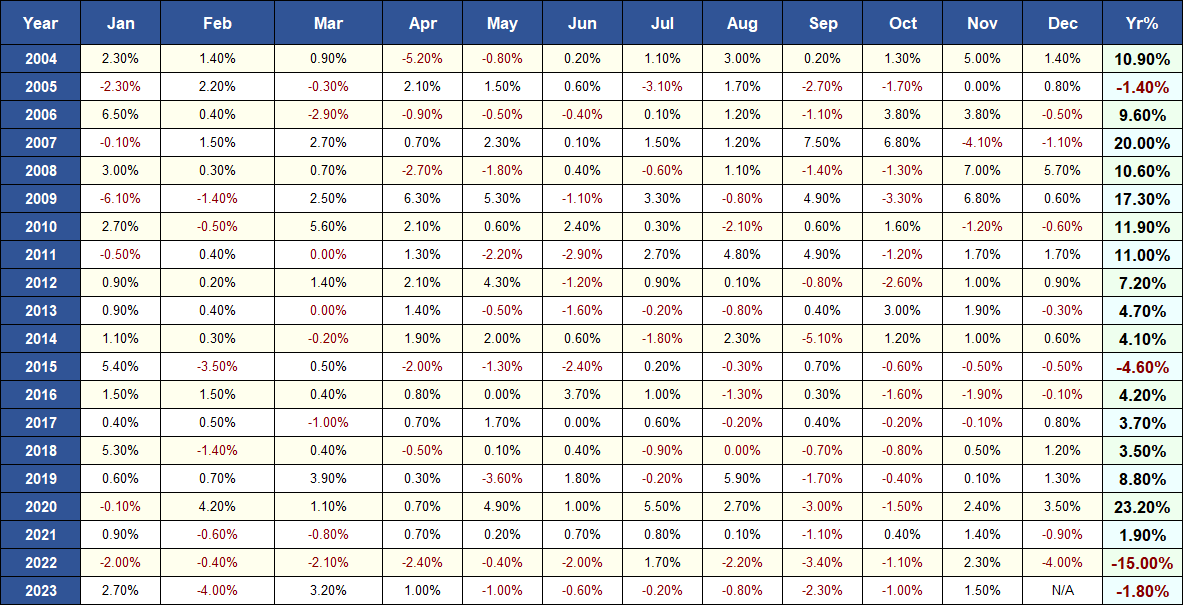
Fig.2 BAA Profit and Draw Down graph vs SPY Buy & Hold:
Momentum Portfolio Allocation (MPA)
The MPA strategy shares a similar concept with the BAA strategy but introduces specific modifications:
- It integrates market filters to allocate capital, ensuring more controllable risk.
- The rebalance is conducted at the end of the month, similar to BAA. However, the strategy requires daily review after market close to assess if any positions need to be closed.
In summary, like the BAA strategy, MPA is executed at the end of each month, allocating capital to assets exhibiting higher momentum. The allocation decision is dynamic, aligning with either defensive assets or offensive assets positions based on the momentum of the assets that form the canary. However, it necessitates daily execution (after market close) to evaluate if any position needs to be closed. This risk management measure aims to mitigate risk and enhance adaptability to changing market conditions.
To evaluate the model, the dataset from Yahoo Finance spanning from 2004 to November 2023 has been partitioned into three distinct sets. The division is as follows:
Out-of-Sample Dataset 1 (2004-2006):
This set encompasses data from 2004 to 2006 and serves as the initial out-of-sample dataset for testing the model.
In-Sample Dataset (2006-2020):
The in-sample dataset covers the period from 2006 to 2020 and has been utilized for the development and refinement of the model.
Out-of-Sample Dataset 2 (2021-2023):
The second out-of-sample dataset includes data from 2021 to 2023 and is utilized to test the model in different market conditions, providing an unbiased evaluation of its performance.
This partitioning strategy allows for a comprehensive assessment of the model's performance across different market conditions and timeframes, contributing to a robust understanding of its effectiveness and consistency.
The assets utilized by the MPA strategy are as follows:
Canary:
Utilizes MME and SPY ETFs to assess whether the portfolio should adopt an offensive or defensive stance.
- EEM (iShares MSCI Emerging Markets ETF): Offers exposure to equities in emerging markets.
- SPY (SPDR S&P 500 ETF Trust): Tracks the performance of the S&P 500 Index.
Defensive Assets:
- DBC (Invesco DB Commodity Index Tracking ETF): Offers exposure to a diversified basket of commodities.
- IEF (iShares 7-10 Year Treasury Bond ETF): Tracks intermediate-term U.S. Treasury bonds.
- TLT (iShares 20+ Year Treasury Bond ETF): Focuses on long-term U.S. Treasury bonds.
- BIL (SPDR Bloomberg Barclays 1-3 Month T-Bill ETF): Tracks short-term U.S. Treasury bills.
- SDS (ProShares UltraShort S&P500): Included for effective performance in declining markets.
Offensive Assets:
- QQQ (Invesco QQQ Trust): Mirrors the performance of the Nasdaq-100 Index.
- EEM (iShares MSCI Emerging Markets ETF): Offers exposure to equities in emerging markets.
- EFA (iShares MSCI EAFE ETF): Tracks developed market equities outside of North America. IWM (iShares Russell 2000 ETF): Focuses on small-cap U.S. stocks.
- XLY (Consumer Discretionary Select Sector SPDR Fund): Provides exposure to the consumer discretionary sector.
- SPY (SPDR S&P 500 ETF Trust): Tracks the performance of the S&P 500 Index.
To transition between offensive and defensive portfolios, MPA utilizes the Canary approach with MME and SPY, along with two market filters. The inclusion of SDS in Defensive Assets aims to enhance performance during market downturns.
This approach aims to refine the risk-reward ratio, increase the adaptability of the trading system, and provide investors with a more resilient and sophisticated tool for navigating dynamic financial markets.
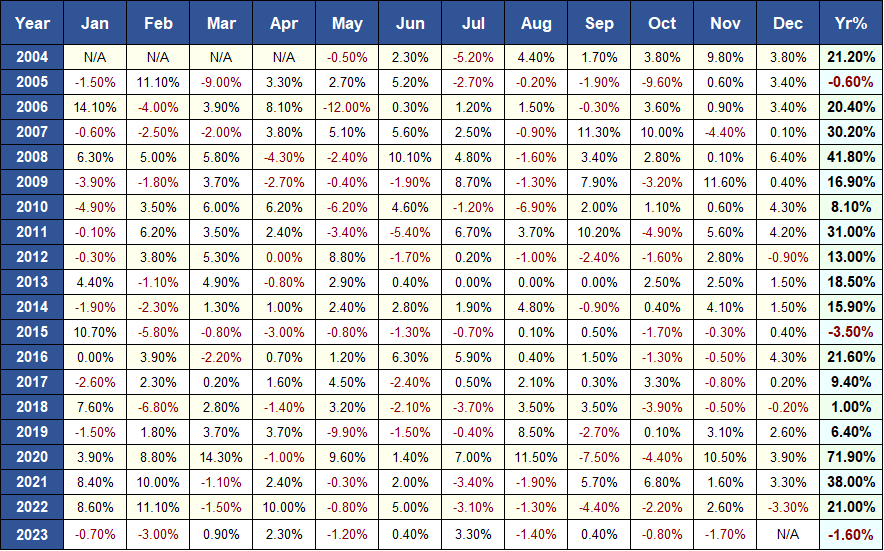
Fig.3 MPA strategy monthly returns: (Yahoo finance only have data to run the strategy from 01/05/2004)
MPA vs BAA
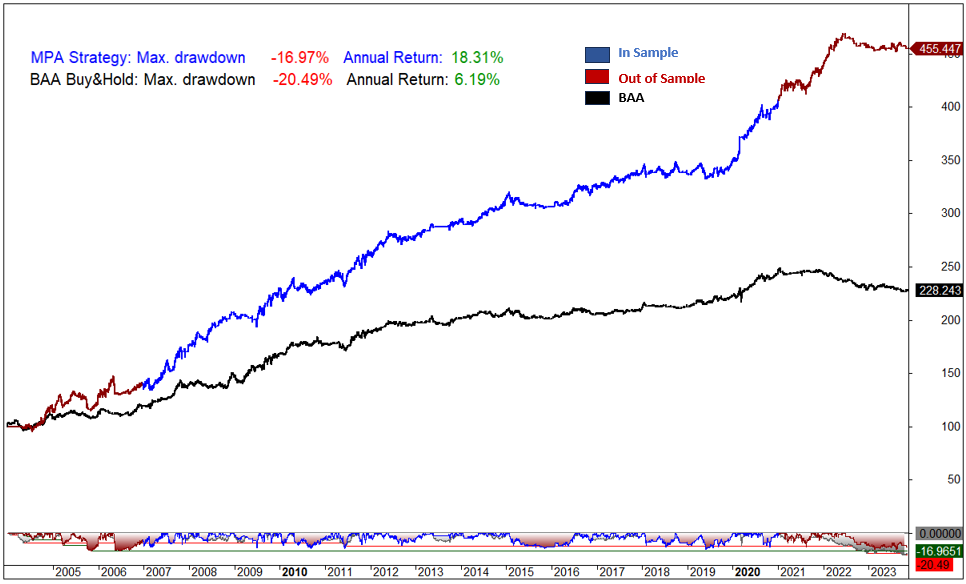
Fig.4 MPA Profit and Draw Down graph vs BAA Strategy:
MPA vs SPY Buy & Hold
Fig. 4 MPA yearly returns Model vs SPY Buy & Hold:
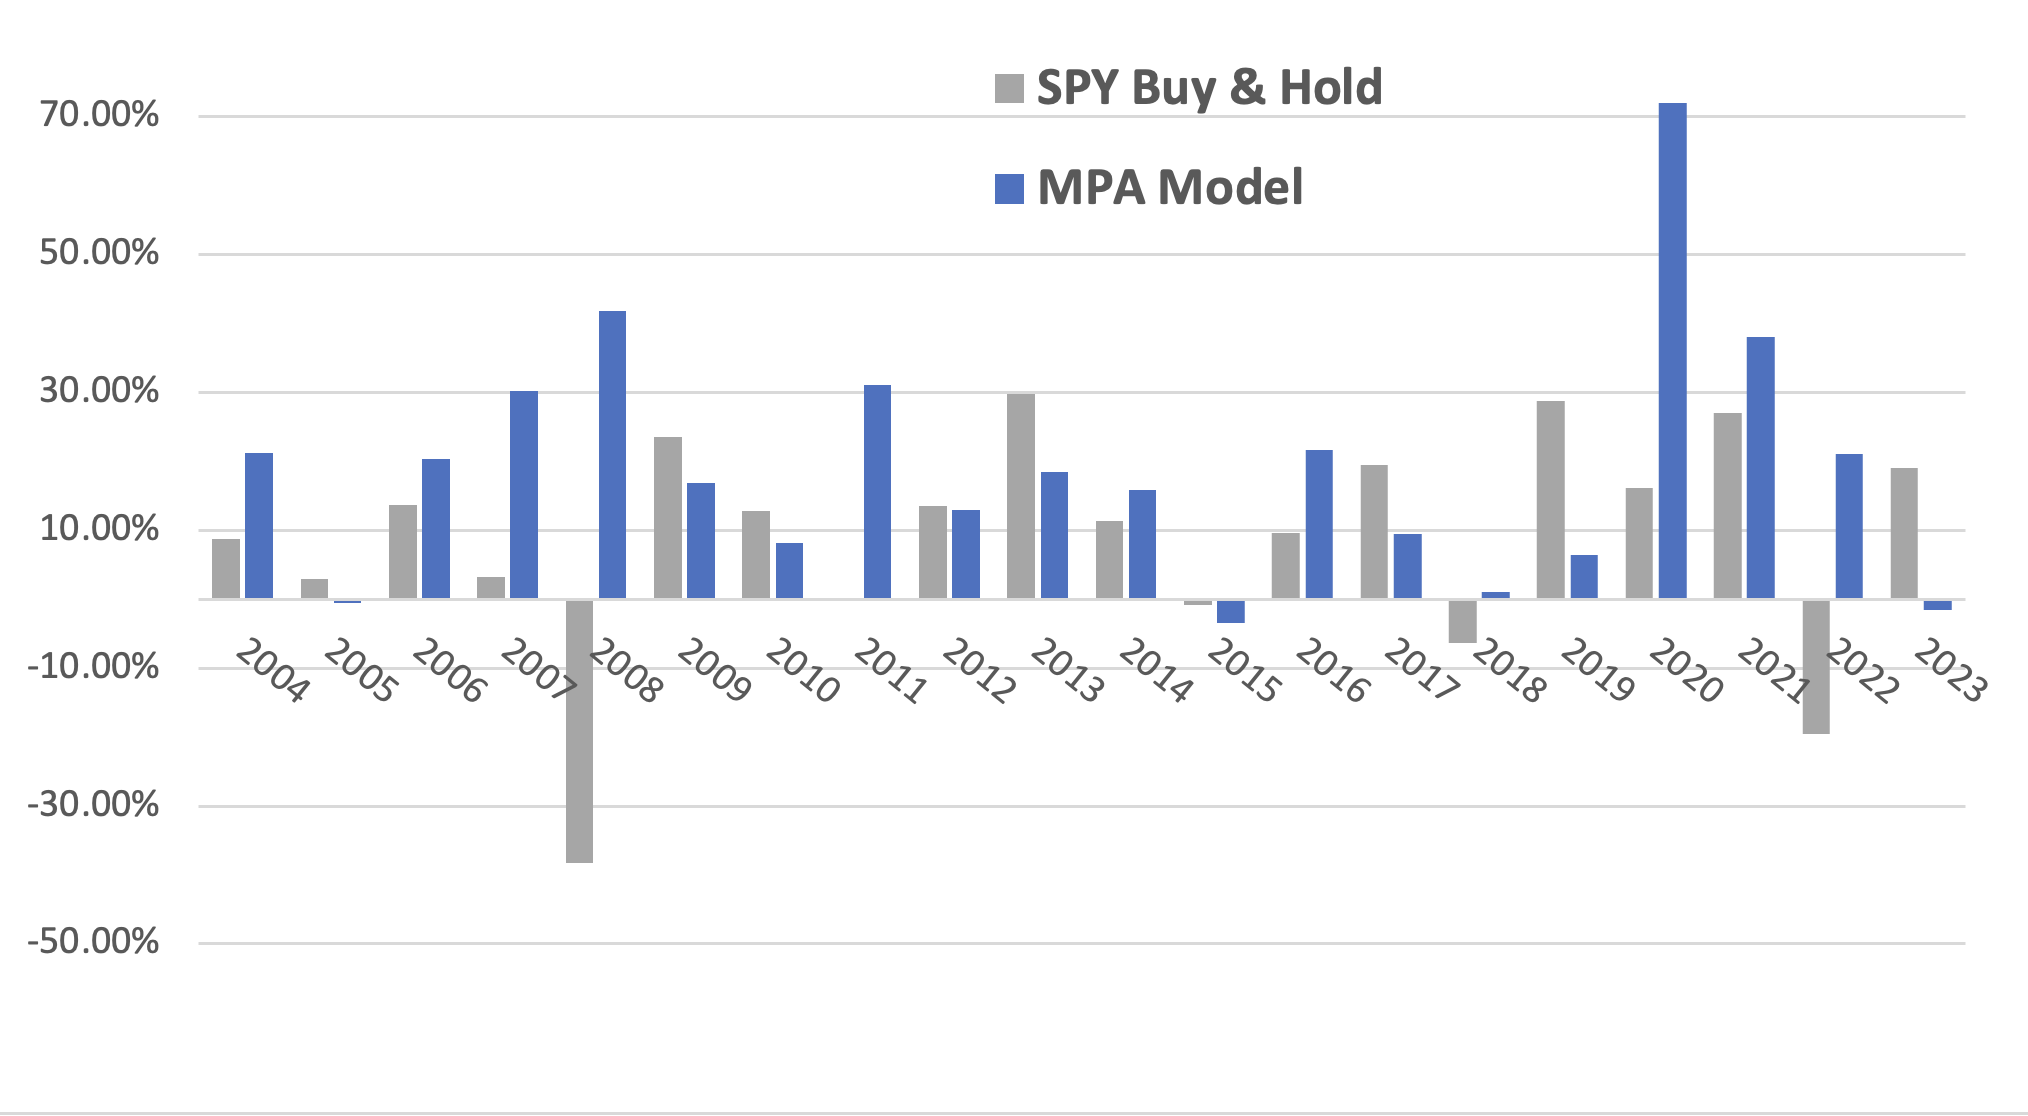
Fig.5 MPA Profit and Draw Down graph vs SPY Buy & Hold:
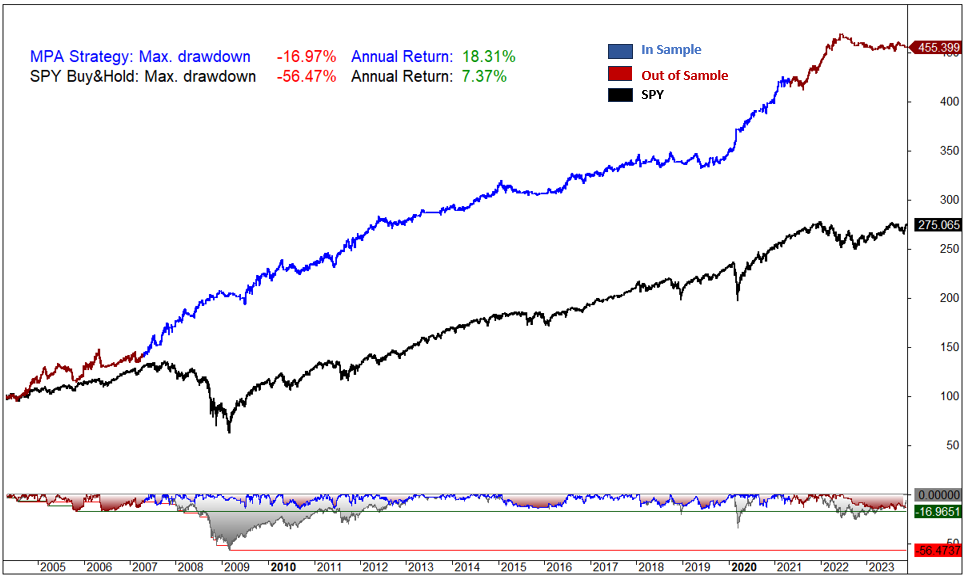
Fig.6 Performance Metrics Comparison: In-Sample vs. Out-of-Sample and MPA System vs BAA
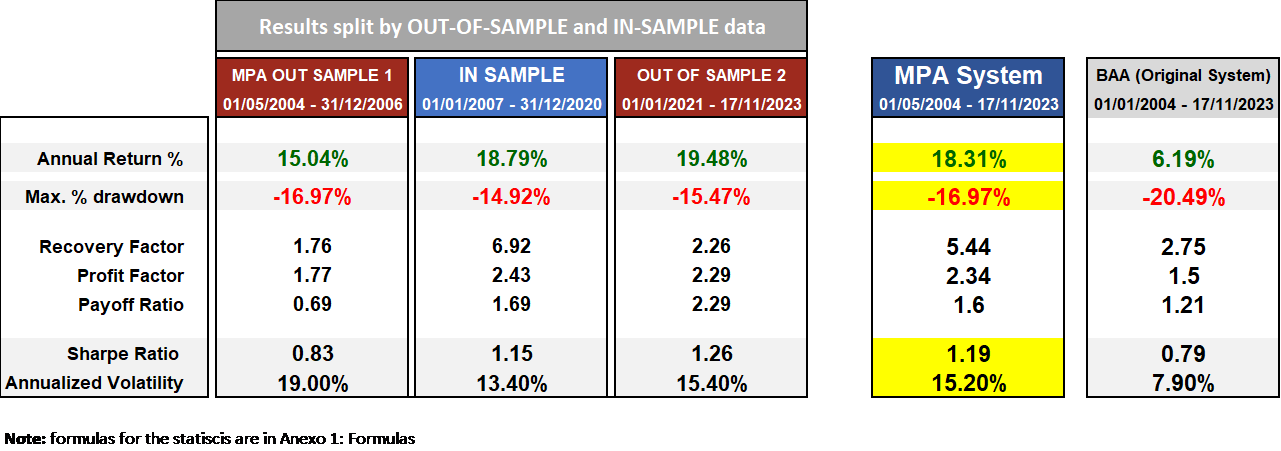
Initial backtesting results demonstrate that the MPA strategy, combining BAA principles with market filters, outperforms the original BAA strategy and a buy & hold SPY ETF when applied to historical data from 2004. Performance metrics, including risk-adjusted returns and drawdown management, indicate improved consistency and effectiveness. However, further real-time testing and validation are necessary to confirm the strategy's robustness across diverse market scenarios.
Conclusion
In conclusion, our study acknowledges the limitations of the original BAA strategy when tested on Yahoo data from 2004. By leveraging BAA principles and introducing market filters, the Momentum Canary Allocation (MCA) strategy seeks to address these limitations, offering a more refined and adaptable approach to asset allocation. The dynamic nature of MCA positions it as a valuable tool for investors seeking to navigate the complexities of the financial markets with enhanced precision and resilience.
Anexo 1: Formulas
Below are the formulas used to calculate the performance metrics:
Annual Return %: The annualized percentage return is a measure of the average annual rate of return on an investment over a specified time period.

Max. system % drawdown: Maximum percentage decline in the value of a trading system from its highest point (peak) to the lowest subsequent point (trough) over a specified period.

Where:
- Peak Value is the highest point in the value of the trading or investment system.
- Trough Value is the lowest subsequent point in the value of the system.
Recovery Factor: Assesses the ability of an investment or trading strategy to recover from losses. It is calculated using the following formula:

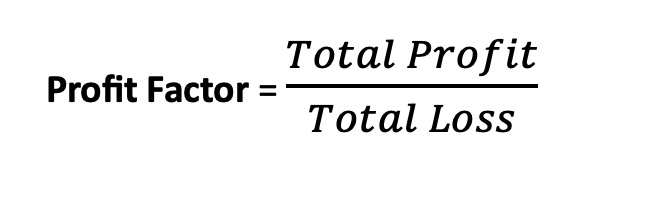
Profit Factor: Measures the profitability of a trading strategy. It is calculated using the following formula:
Payoff Ratio: Also known as the risk-reward ratio, is a financial metric used in investing to assess the potential return of an investment relative to the amount of risk undertaken.

Sharpe Ratio: Is a measure of the risk-adjusted performance of a trading strategy. It helps investors evaluate the return of an investment relative to its risk.

Where:
- Investment Return is the return of the investment or portfolio.
- Risk-Free RateRisk-Free Rate is the return on a risk-free investment.
- Investment Standard Deviation is the standard deviation of the Investment’s returns, which measures the volatility or risk of the portfolio.
Annualized Volatility: Is a measure of the variability of returns of an investment over a one-year period, expressed as a percentage. It is commonly used in finance to quantify the level of risk or uncertainty associated with an investment.
Calculated using Monthly returns:

Where:
- Monthly Volatility is the standard deviation of monthly returns.
- 12 is the number of months in a year.