Abstract
This paper explores the potential for improving returns and reducing drawdowns in lazy portfolios through the simple incorporation of market filters.
Beginning with a basic lazy portfolio allocation of 25% Gold, 25% Bonds, 25% SPY, and 25% QQQ (50% offensive, 50% defensive), the objective is to enhance performance and minimize drawdowns by using market filters.
The study utilizes Yahoo Finance data from January 2005 to November 2023, divided into three datasets, one for in-sample data to develop the model and two of for out-of-sample data to validate the model, as detailed in the subsequent sections of this document.
Introduction
Lazy portfolios have garnered attention for their passive approach, but there exists potential for performance enhancement. This paper aims to explore the details of lazy portfolios, identify their strengths and weaknesses, and advocate for the integration of market filters to strengthen performance while reduce drawdowns.
Lazy Portfolio: Advantages and Disadvantages:
Lazy portfolios, while known for their simplicity and cost-effectiveness, often lack adaptability. A detailed examination of their pros and cons sets the stage for the subsequent enhancement strategy proposed in this paper.
Pros and Cons of Lazy Portfolios:
Pros:
- Simplicity: Lazy portfolios are known for their simplicity, offering a straightforward mix of assets in predetermined proportions, making them easy to understand and implement.
- Low Maintenance: Lazy portfolios require minimal ongoing management, with infrequent rebalancing, making them suitable for investors who prefer a hands-off or less time-consuming investment strategy.
- Diversification: Lazy portfolios often include a mix of asset classes, spreading risk across different investments and adhering to the fundamental principle of risk management.
- Cost-Effectiveness: Implementing a lazy portfolio can be cost-effective, especially if it consists of low-cost index funds or ETFs.
- Consistency of Strategy: Lazy portfolios maintain a consistent investment strategy over time, contributing to a stable and predictable investment experience and discouraging impulsive decision-making.
Cons:
- Limited Adaptability: Lazy portfolios may not adapt well to rapidly changing market conditions due to their static asset allocation strategy, potentially leading to suboptimal performance in certain economic environments.
- Potential for Underperformance: In periods of market volatility or significant economic shifts, lazy portfolios may underperform compared to more actively managed strategies that make frequent adjustments in response to emerging trends.
- Delayed Response to Market Changes: With infrequent rebalancing, lazy portfolios might not promptly respond to sudden market changes, potentially resulting in missed opportunities or prolonged exposure to declining assets.
- Susceptibility to Extended Market Downturns: Due to their passive nature, lazy portfolios may be more susceptible to prolonged market downturns, experiencing longer recovery periods compared to more actively managed strategies.
- Limited Risk Management Strategies: Lazy portfolios may lack sophisticated risk management strategies, exposing investors to higher risk levels compared to actively managed portfolios.
While lazy portfolios offer simplicity and cost-effectiveness, investors must weigh the pros and cons carefully. The key is finding a balance that aligns with individual risk tolerance, investment goals and time dedication.
Basic Lazy Portfolio Construction
For the purposes of this paper, a Lazy portfolio comprising 25% Gold, 25% bonds, and 50% equity has been utilized. This well-balanced mix aims to achieve an optimal equilibrium between offensive and defensive assets, forming a robust foundation for performance enhancement. The selected Exchange-Traded Funds (ETFs) used for this portfolio are:
Gold:
- GLD - SPDR Gold Trust: GLD is designed to track the performance of gold bullion.
Fixed Income:
- TLT - iShares 20+ Year Treasury Bond: TLT tracks long-term U.S. Treasury bonds.
Equity: It uses 2 ETFs equally weighted.
- SPY - SPDR S&P 500 ETF Trust: SPY is designed to track the S&P 500.
- QQQ - Invesco QQQ Trust: QQQ tracks the Nasdaq 100 Index.
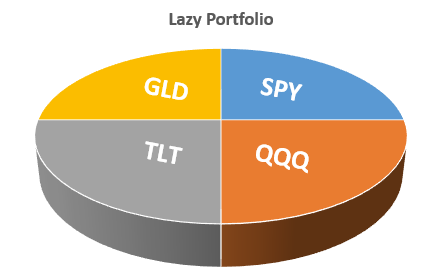
The portfolio is structured with a 25% allocation to each of GLD, TLT, SPY, and QQQ. Managed through a period rebalancing strategy, this involves adjusting the asset allocation back to its original proportions at the end of each period. While ensuring adherence to the predetermined allocation, this periodic rebalancing introduces an element of rigidity, potentially limiting the portfolio's adaptability to evolving market trends.
For this studio we will check the portfolio performance in four different rebalancing strategies:
- Buy & hold (not rebalancing)
- Yearly rebalancing
- quarterly rebalancing
- monthly rebalancing
Basic Lazy Portfolio Backtesting Results
The graphs below illustrate the performance comparison between the lazy portfolio and the SPY Buy & Hold Strategy.
Fig.1 illustrates Profit and Draw Down of the Lazy Portfolio Buy & Hold compared to the SPY Buy & Hold:
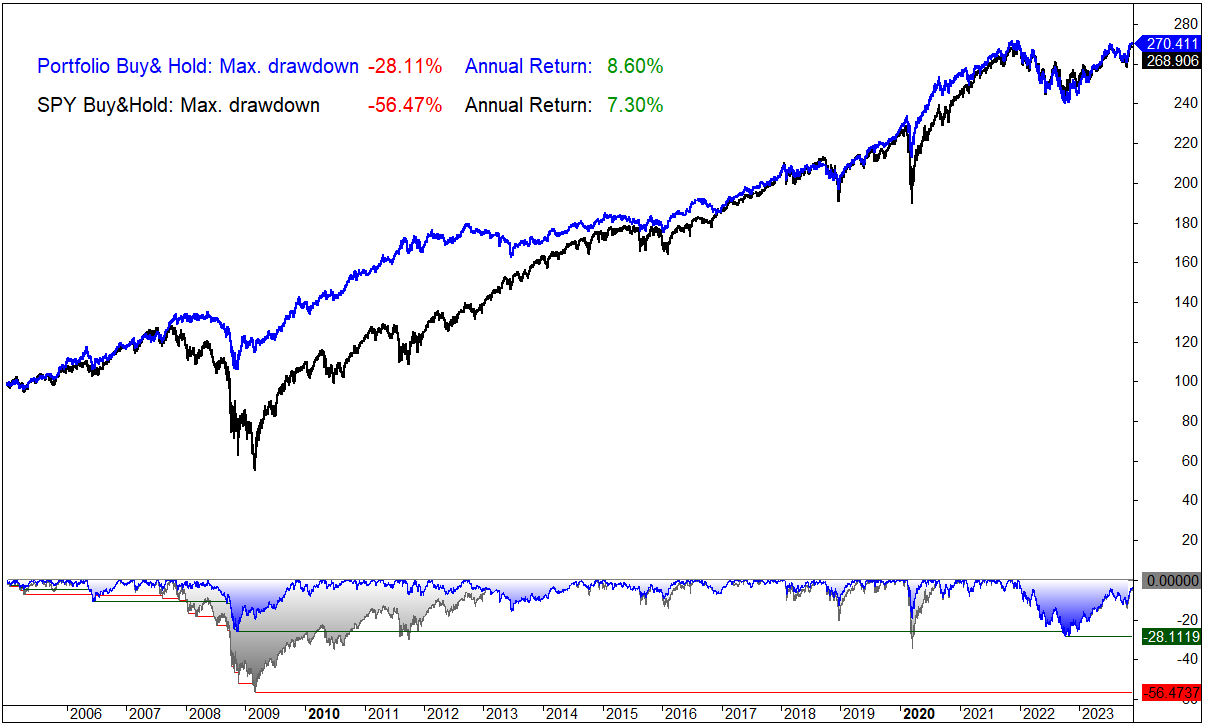
Fig.2 illustrates Profit and Draw Down of the Lazy Portfolio yearly rebalancing compared to the SPY Buy & Hold:

Fig.3 illustrates Profit and Draw Down of the Lazy Portfolio Quarterly rebalancing compared to the SPY Buy & Hold:
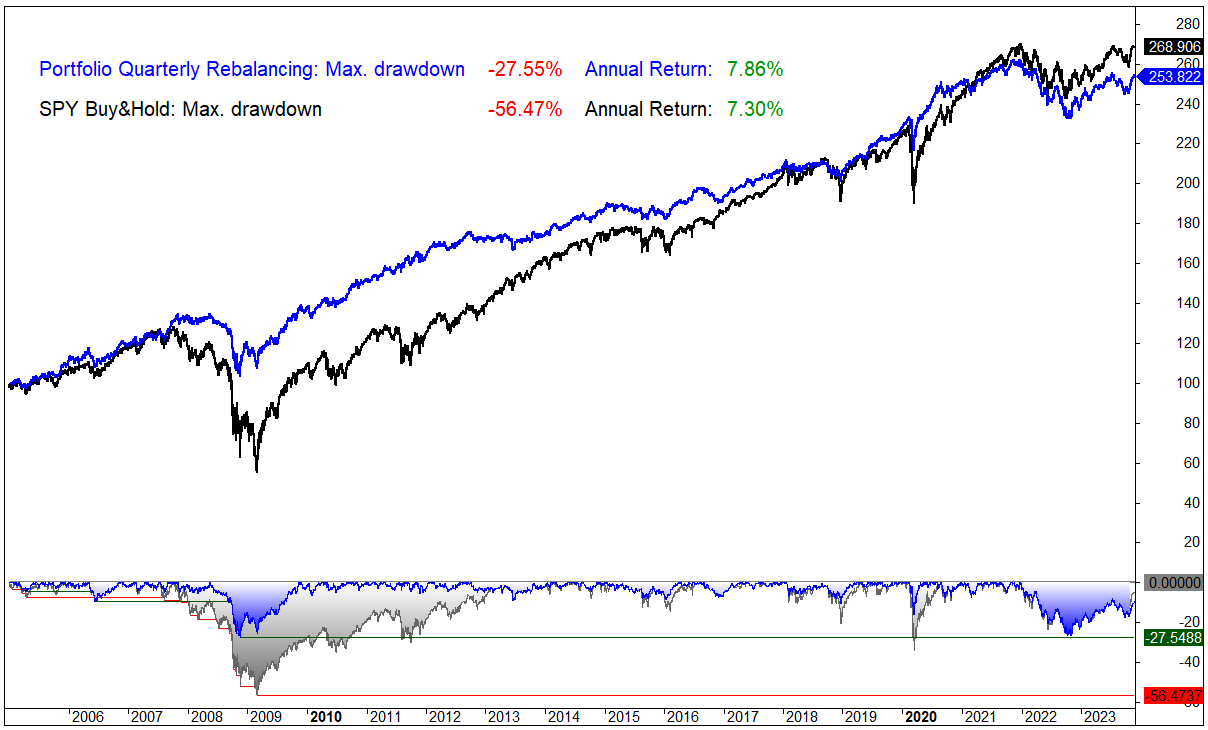
Fig.4 illustrates Profit and Draw Down of the Lazy Portfolio Monthly rebalancing compared to the SPY Buy & Hold:
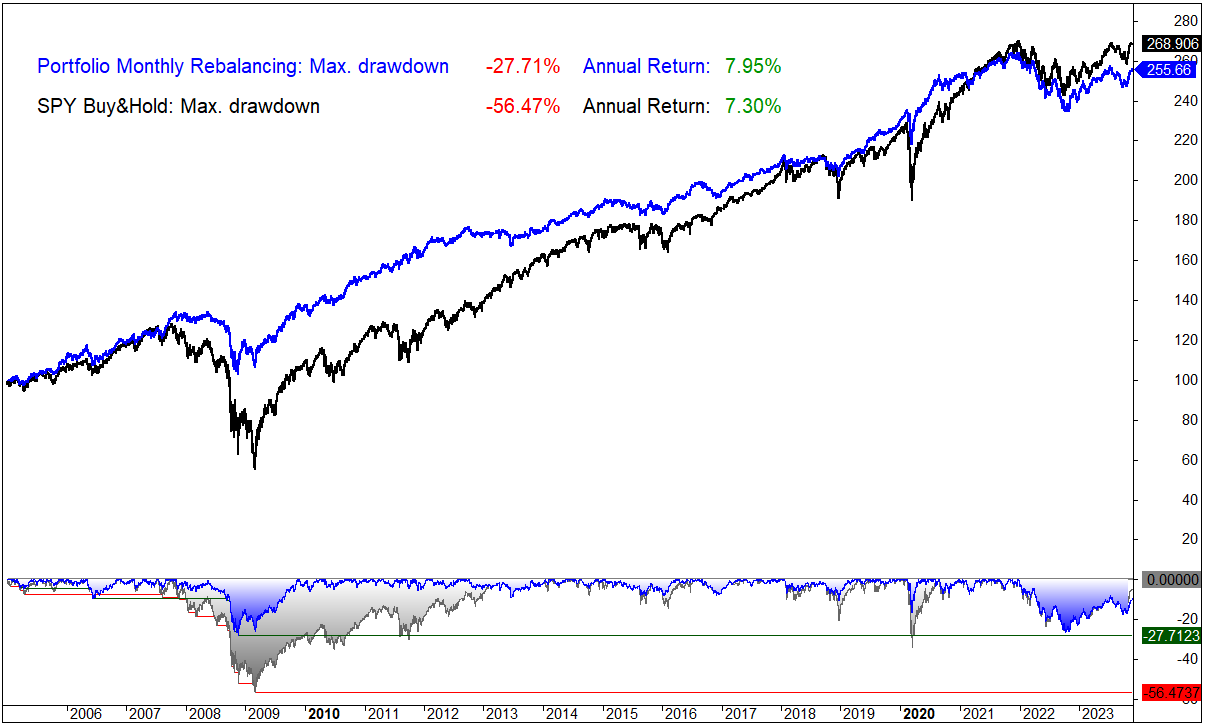
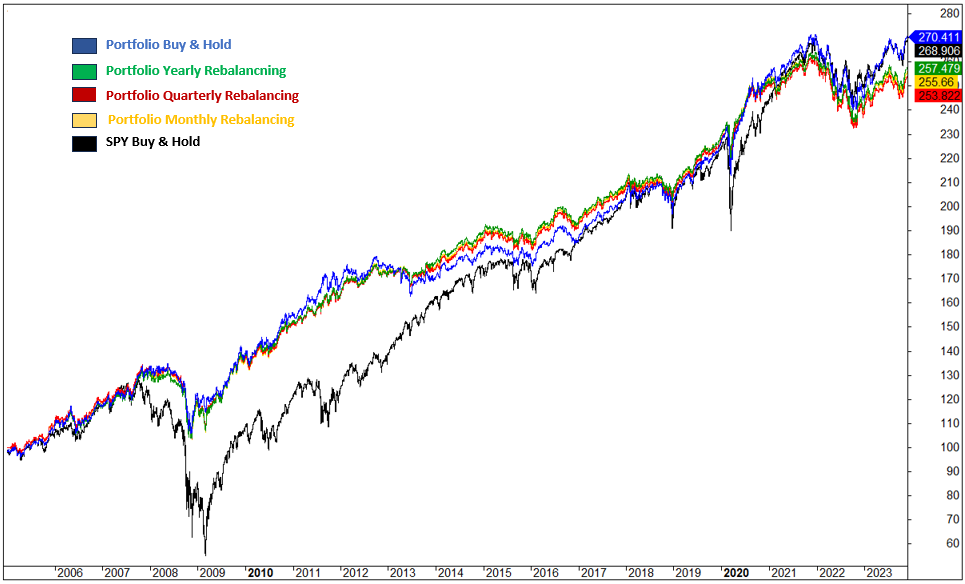
Fig.5 illustrates Profit and Draw Down of the four Lazy Portfolio rebalancing strategies compared to the SPY Buy & Hold:
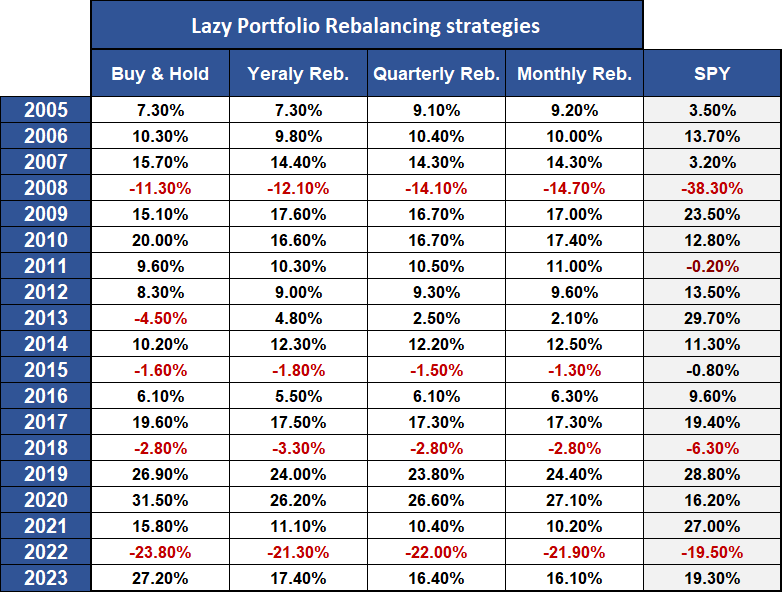
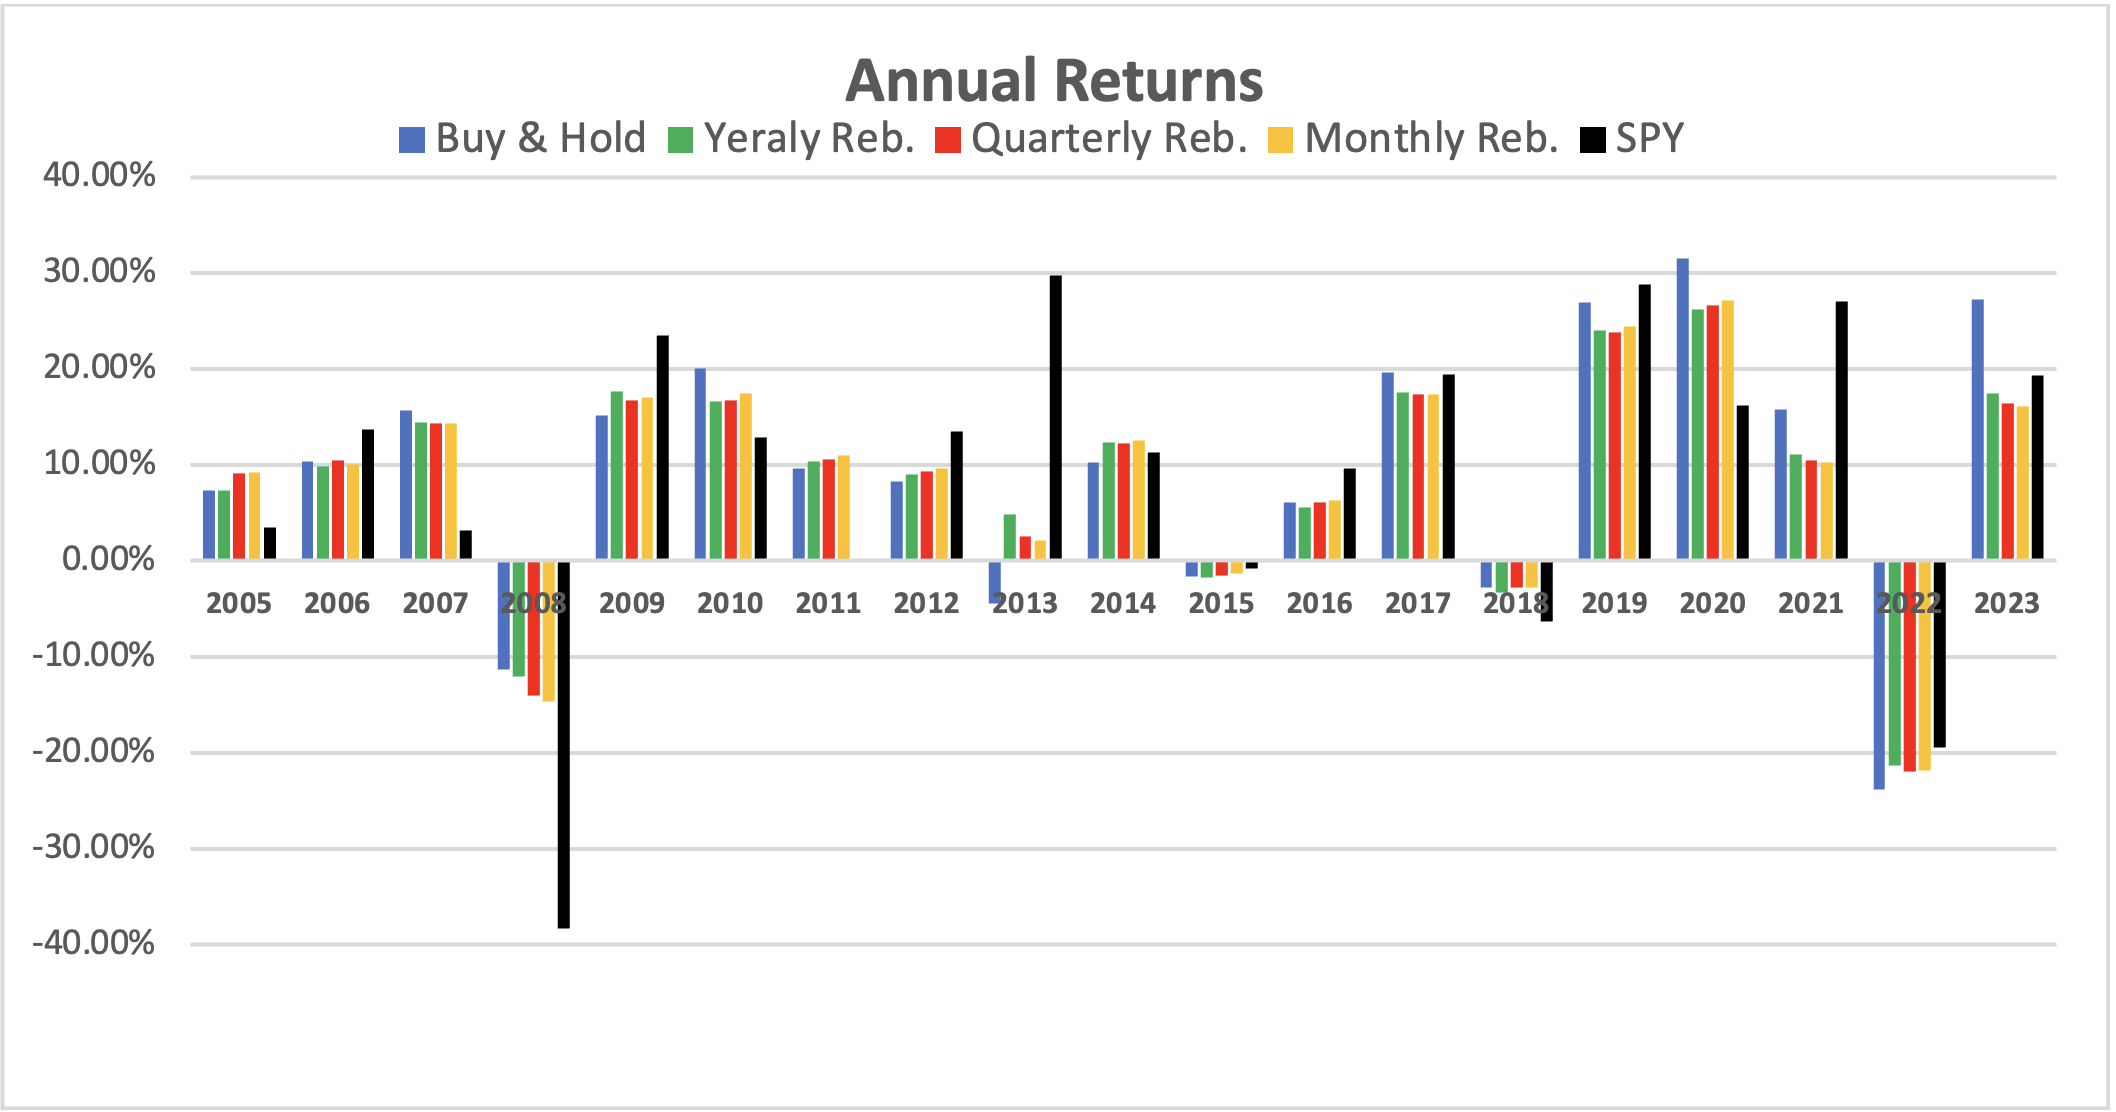
Annual Returns:
Metrics
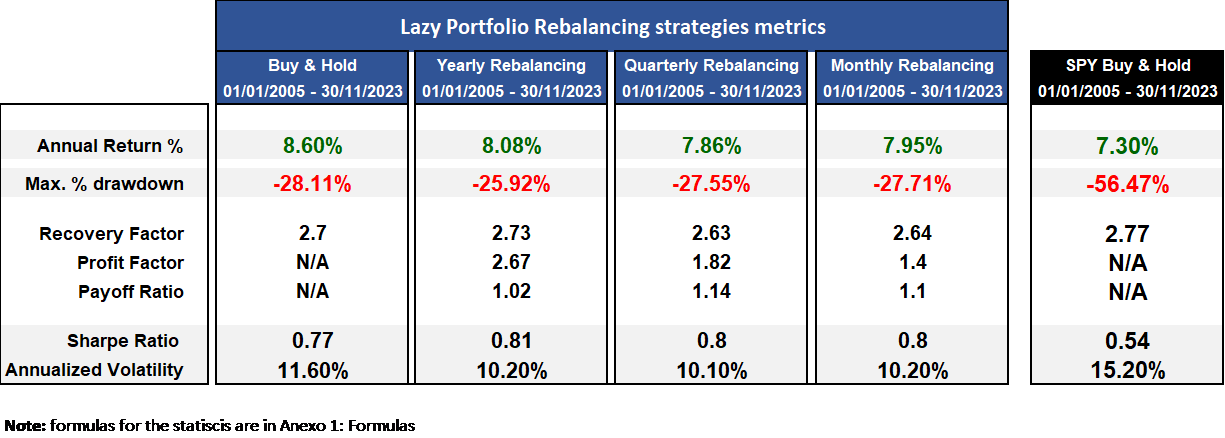
The results reveal that the rebalancing strategies apply to the lazy portfolio, including yearly, quarterly, and monthly rebalancing, did not significantly enhance performance or reduce drawdown compared to a simple buy-and-hold the four ETFs that form the portfolio.
The annual returns for buy and hold (8.60%), yearly rebalancing (8.08%), quarterly rebalancing (7.86%), and monthly rebalancing (7.95%) are quite similar, suggesting that the frequency of rebalancing does not yield substantial improvements.
Additionally, all rebalancing strategies outperformed the SPY benchmark, which had an annual return of 7.30% and a drawdown of -56.47%.
These results indicate that, while lazy portfolios with various rebalancing periods did not exhibit significant differences in performance among themselves, they consistently outperformed the benchmark (SPY Buy and Hold). It is especially notable that the maximum drawdown is reduced to nearly 50% in all four rebalancing approaches compared to the SPY buy-and-hold strategy.
This suggests the potential benefits of a strategic portfolio approach compared to a passive index buy-and-hold strategy. It underscores the effectiveness of incorporating a thoughtful selection of ETFs in a portfolio, as opposed to adopting a buy-and-hold index approach, highlighting the value of minimizing drawdowns in investment performance.
Further validation tests could be considered. For instance, exploring scenarios like adding additional capital into the portfolio monthly or when the drawdown reaches predetermined thresholds. The potential avenues for testing and refining the strategy are endless.
The subsequent section of the paper will shift its focus to using a monthly rebalancing, with the integration of market filters. This examination aims to determine whether these additional elements can contribute to enhancing the performance of the four rebalancing strategies.
Adding Market Filters and Indicators to the strategy
Methodology
The methodology initiates by utilizing the market filters to categorize the market into distinct risk scenarios, ranging from extreme risk to very low risk. Capital is assigned to the different Assets dynamically, responding to the perceived risk levels within each scenario introducing a flexible and adaptive dimension to the portfolio management.
These filters serve as a mechanism to gauge the current state of the market, that would be used to allocate the capital in a dynamic way during the rebalancing process at the end of the month. This dynamic approach enables the portfolio to transition between offensive and defensive positions, aligning with the evolving dynamics of the market.
Specifically, the market is segmented into seven possible risk scenarios, each representing a spectrum from extreme risk to very low risk. Depending on the identified scenario, capital is allocated dynamically among GLD, TLT, SPY, and QQQ. In summary capital is allocated to offensive or defensive positions based on the risk scenario.
This monthly dynamic rebalancing enhances the strategy to adapt to changing market conditions. By recalibrating asset allocations at the end of each month, the strategy remains agile, optimizing its positioning in response to the prevailing risk environment.
Although the focus of this paper is not to provide an exhaustive description of the filters or the market risk classification mechanism, it's important to mention that some of the utilized filters include VIX structure, asset momentum, and moving averages.
Implementation:
To develop and evaluate the model, we've partitioned the dataset from Yahoo Finance from 2005 to November 2023 into three distinct sets:
In-Sample Dataset (2008-2020):
The in-sample dataset covers the period from 2008 to 2020 and has been utilized for the development and refinement of the model.
Out-of-Sample Dataset 1 (2005-2007):
This set encompasses data from 2005 to 2007 and serves as the initial out-of-sample dataset for testing the model.
Out-of-Sample Dataset 2 (2021-2023):
The second out-of-sample dataset includes data from 2021 to 2023 and is utilized to test the model in different market conditions, providing an unbiased evaluation of its performance.
Execution:
At the end of each month, the model is executed, and the portfolio is rebalanced according to the perceived market risk indicated by market indicators. Orders are then placed the next day at the markets open.
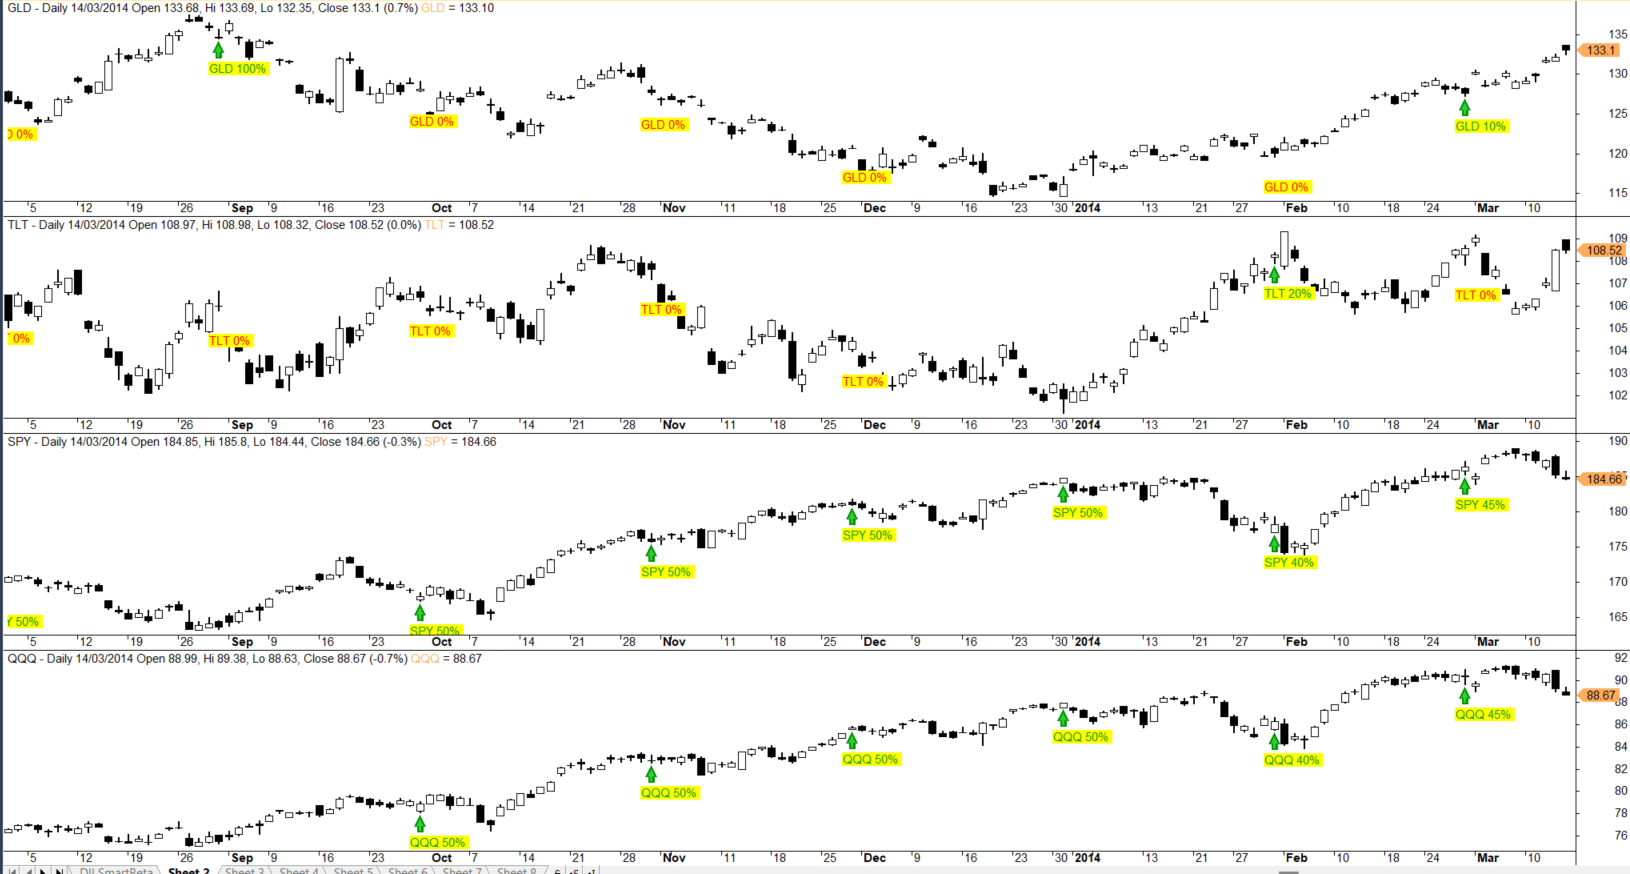
Figure 6 illustrates the ETF weightings as indicated by the model at the conclusion of each period.
Results
Fig.7 Performance Metrics Comparison: In-Sample vs. Out-of-Sample and Model vs SPY Buy and Hold
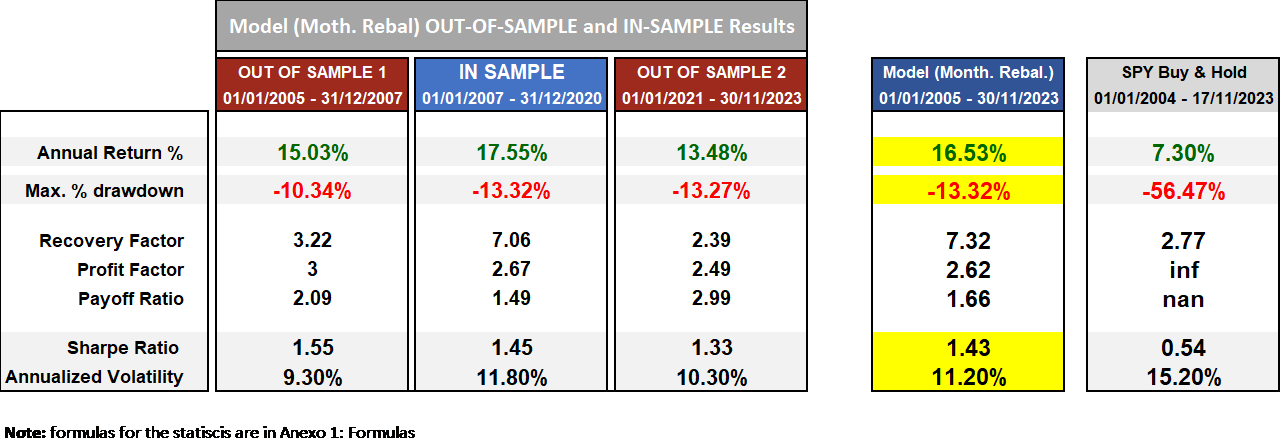
Fig. 8 yearly returns Model vs SPY Buy & Hold:
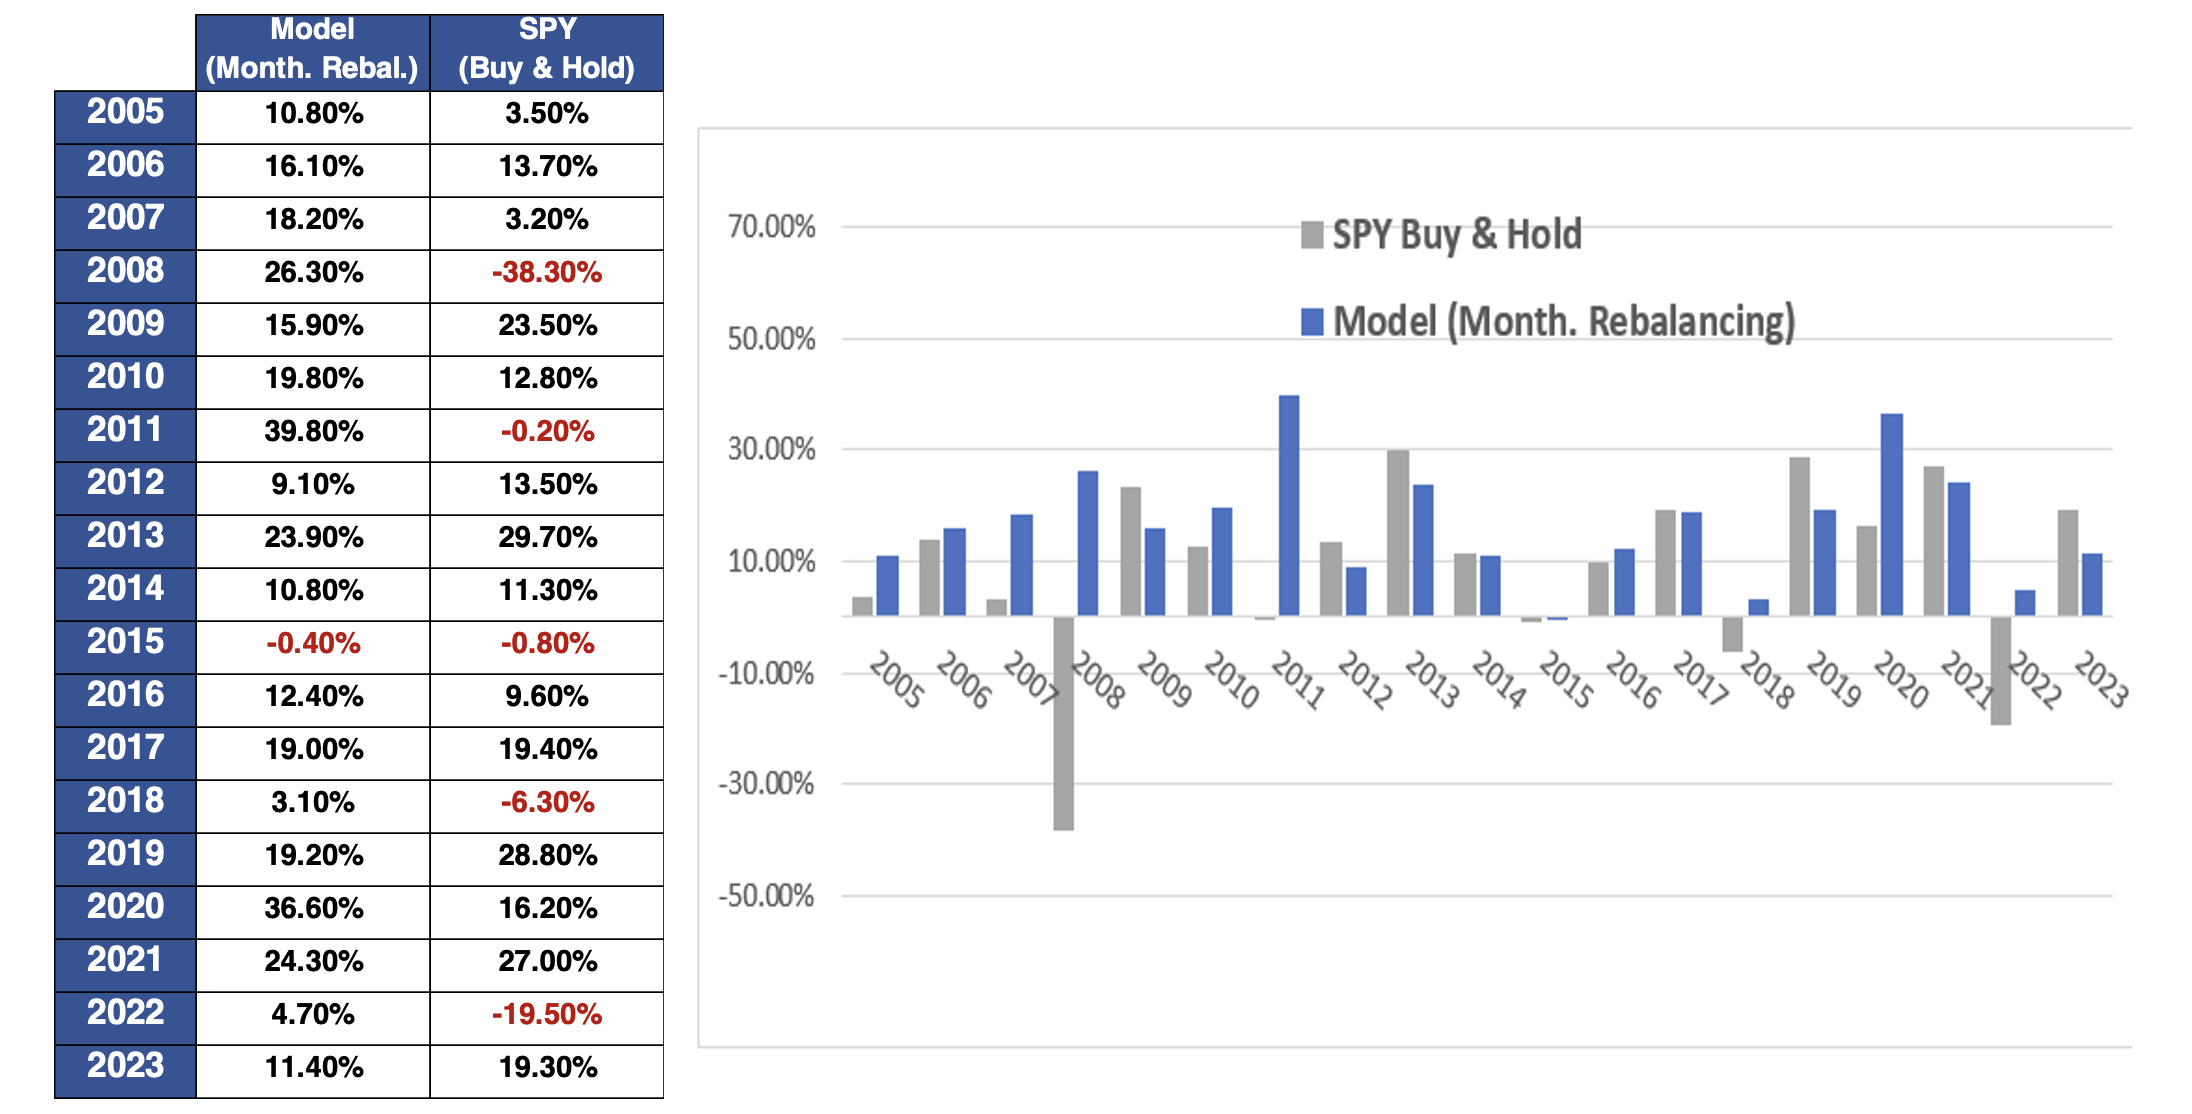
Fig.9 illustrates Profit and Draw Down of the Model Monthly rebalancing compared to the SPY Buy & Hold
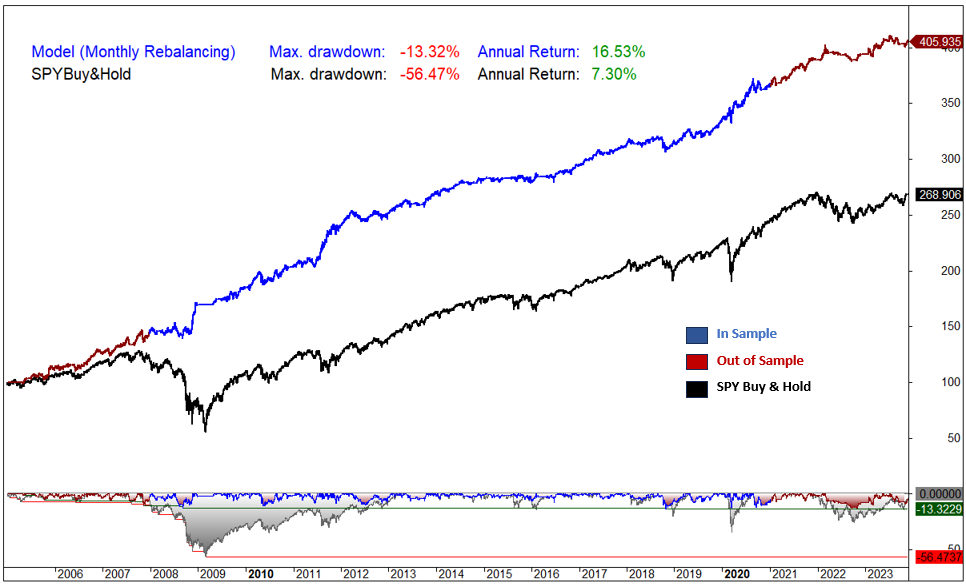
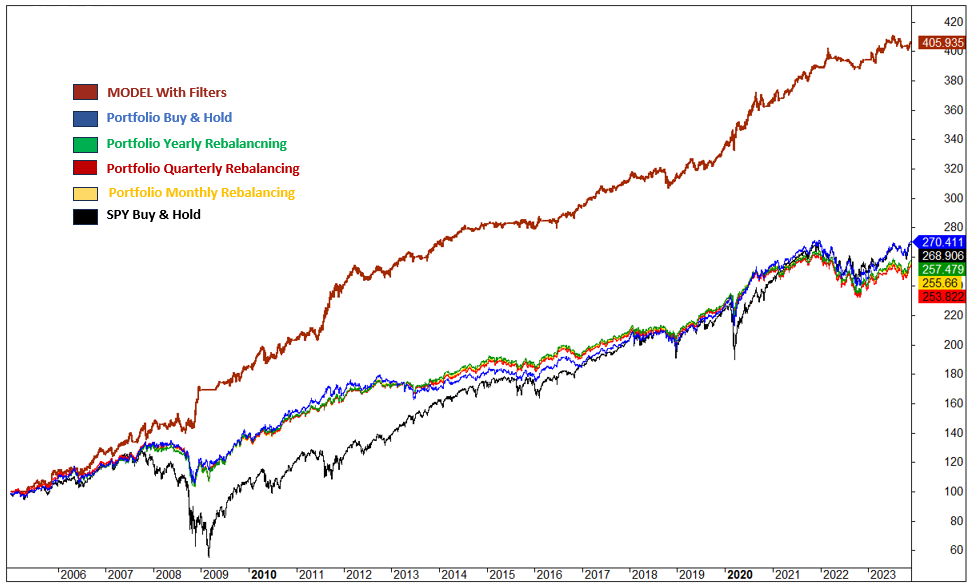
Fig.10 illustrates Profit and Draw Down of the Model Monthly rebalancing compared to the four Lazy Portfolio rebalancing strategies and to SPY Buy & Hold:
Conclusion
In conclusion, this paper explores the potential enhancements to lazy portfolio performance through the integration of market filters and a monthly dynamic rebalancing strategy. The results demonstrate that a monthly dynamic rebalancing strategy based on markets risk perception, outperforms traditional lazy portfolios fixed rebalancing approaches, as well as the SPY buy-and-hold strategy.
The improved version shows a yearly return of 16.53% with a controlled drawdown of 13.32%, illustrating that introduced enhancements, such as the integration of market filters to assess market risks and dynamically assigned capital based on risk perception, effectively address the issue of limited adaptability to market changes.
This approach allows the portfolio to dynamically adjust to evolving market conditions, ensuring a more flexible investment strategy. The dynamic allocation strategy proves effective in maximizing returns while minimizing risk, emphasizing its adaptability in transitioning between offensive and defensive positions based on perceived risk levels.
This paper contributes valuable insights into the realm of portfolio management, emphasizing the importance of flexibility and adaptability in optimizing returns and mitigating risks. Further avenues for research could explore additional refinement strategies, ensuring a comprehensive understanding of optimal portfolio management in various market scenarios. Overall, this study provides a foundation for future research on dynamic investment strategies and their application to portfolio management.
Anexo 1: Formulas
Below are the formulas used to calculate the performance metrics:
Annual Return %: The annualized percentage return is a measure of the average annual rate of return on an investment over a specified time period.

Max. system % drawdown: Maximum percentage decline in the value of a trading system from its highest point (peak) to the lowest subsequent point (trough) over a specified period.

Where:
- Peak Value is the highest point in the value of the trading or investment system.
- Trough Value is the lowest subsequent point in the value of the system.
Recovery Factor: Assesses the ability of an investment or trading strategy to recover from losses. It is calculated using the following formula:

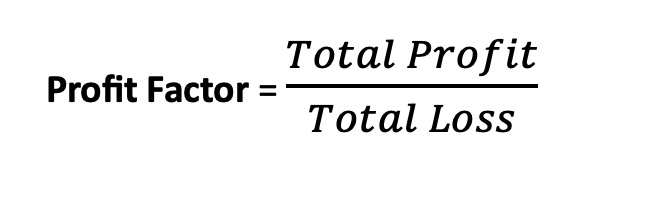
Profit Factor: Measures the profitability of a trading strategy. It is calculated using the following formula:
Payoff Ratio: Also known as the risk-reward ratio, is a financial metric used in investing to assess the potential return of an investment relative to the amount of risk undertaken.

Sharpe Ratio: Is a measure of the risk-adjusted performance of a trading strategy. It helps investors evaluate the return of an investment relative to its risk.

Where:
- Investment Return is the return of the investment or portfolio.
- Risk-Free RateRisk-Free Rate is the return on a risk-free investment.
- Investment Standard Deviation is the standard deviation of the Investment’s returns, which measures the volatility or risk of the portfolio.
Annualized Volatility: Is a measure of the variability of returns of an investment over a one-year period, expressed as a percentage. It is commonly used in finance to quantify the level of risk or uncertainty associated with an investment.
Calculated using Monthly returns:

Where:
- Monthly Volatility is the standard deviation of monthly returns.
- 12 is the number of months in a year.